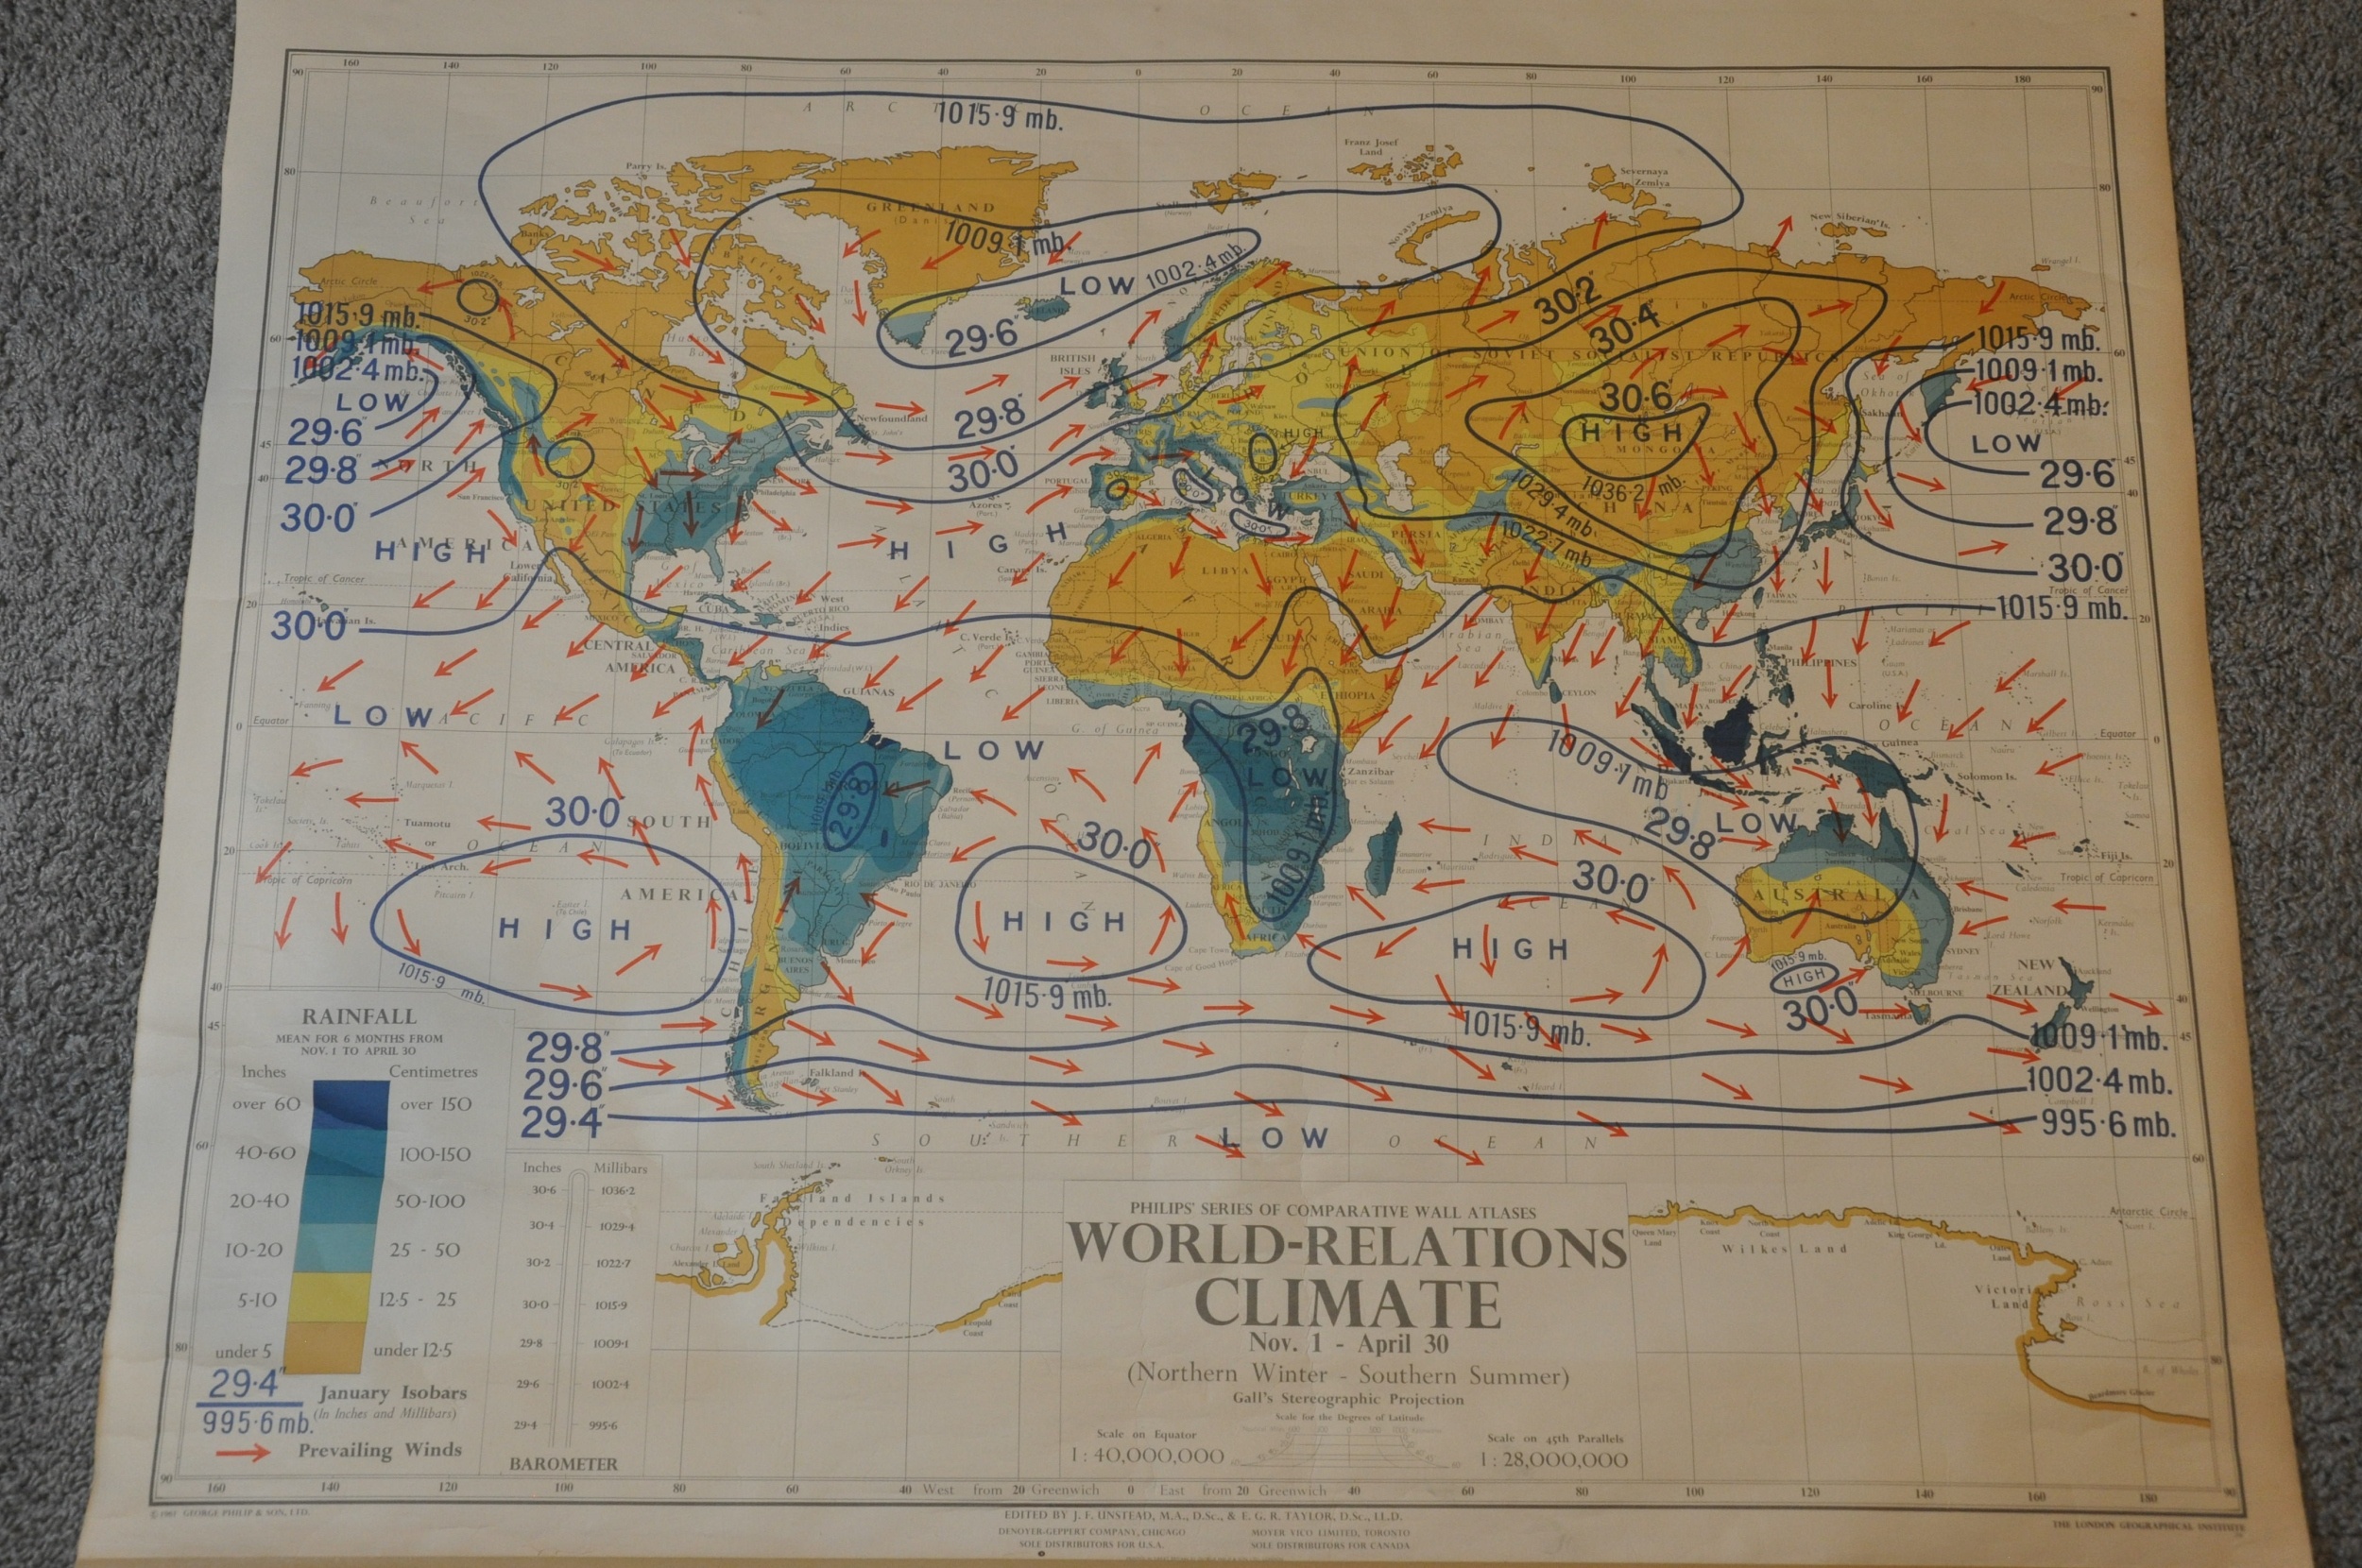
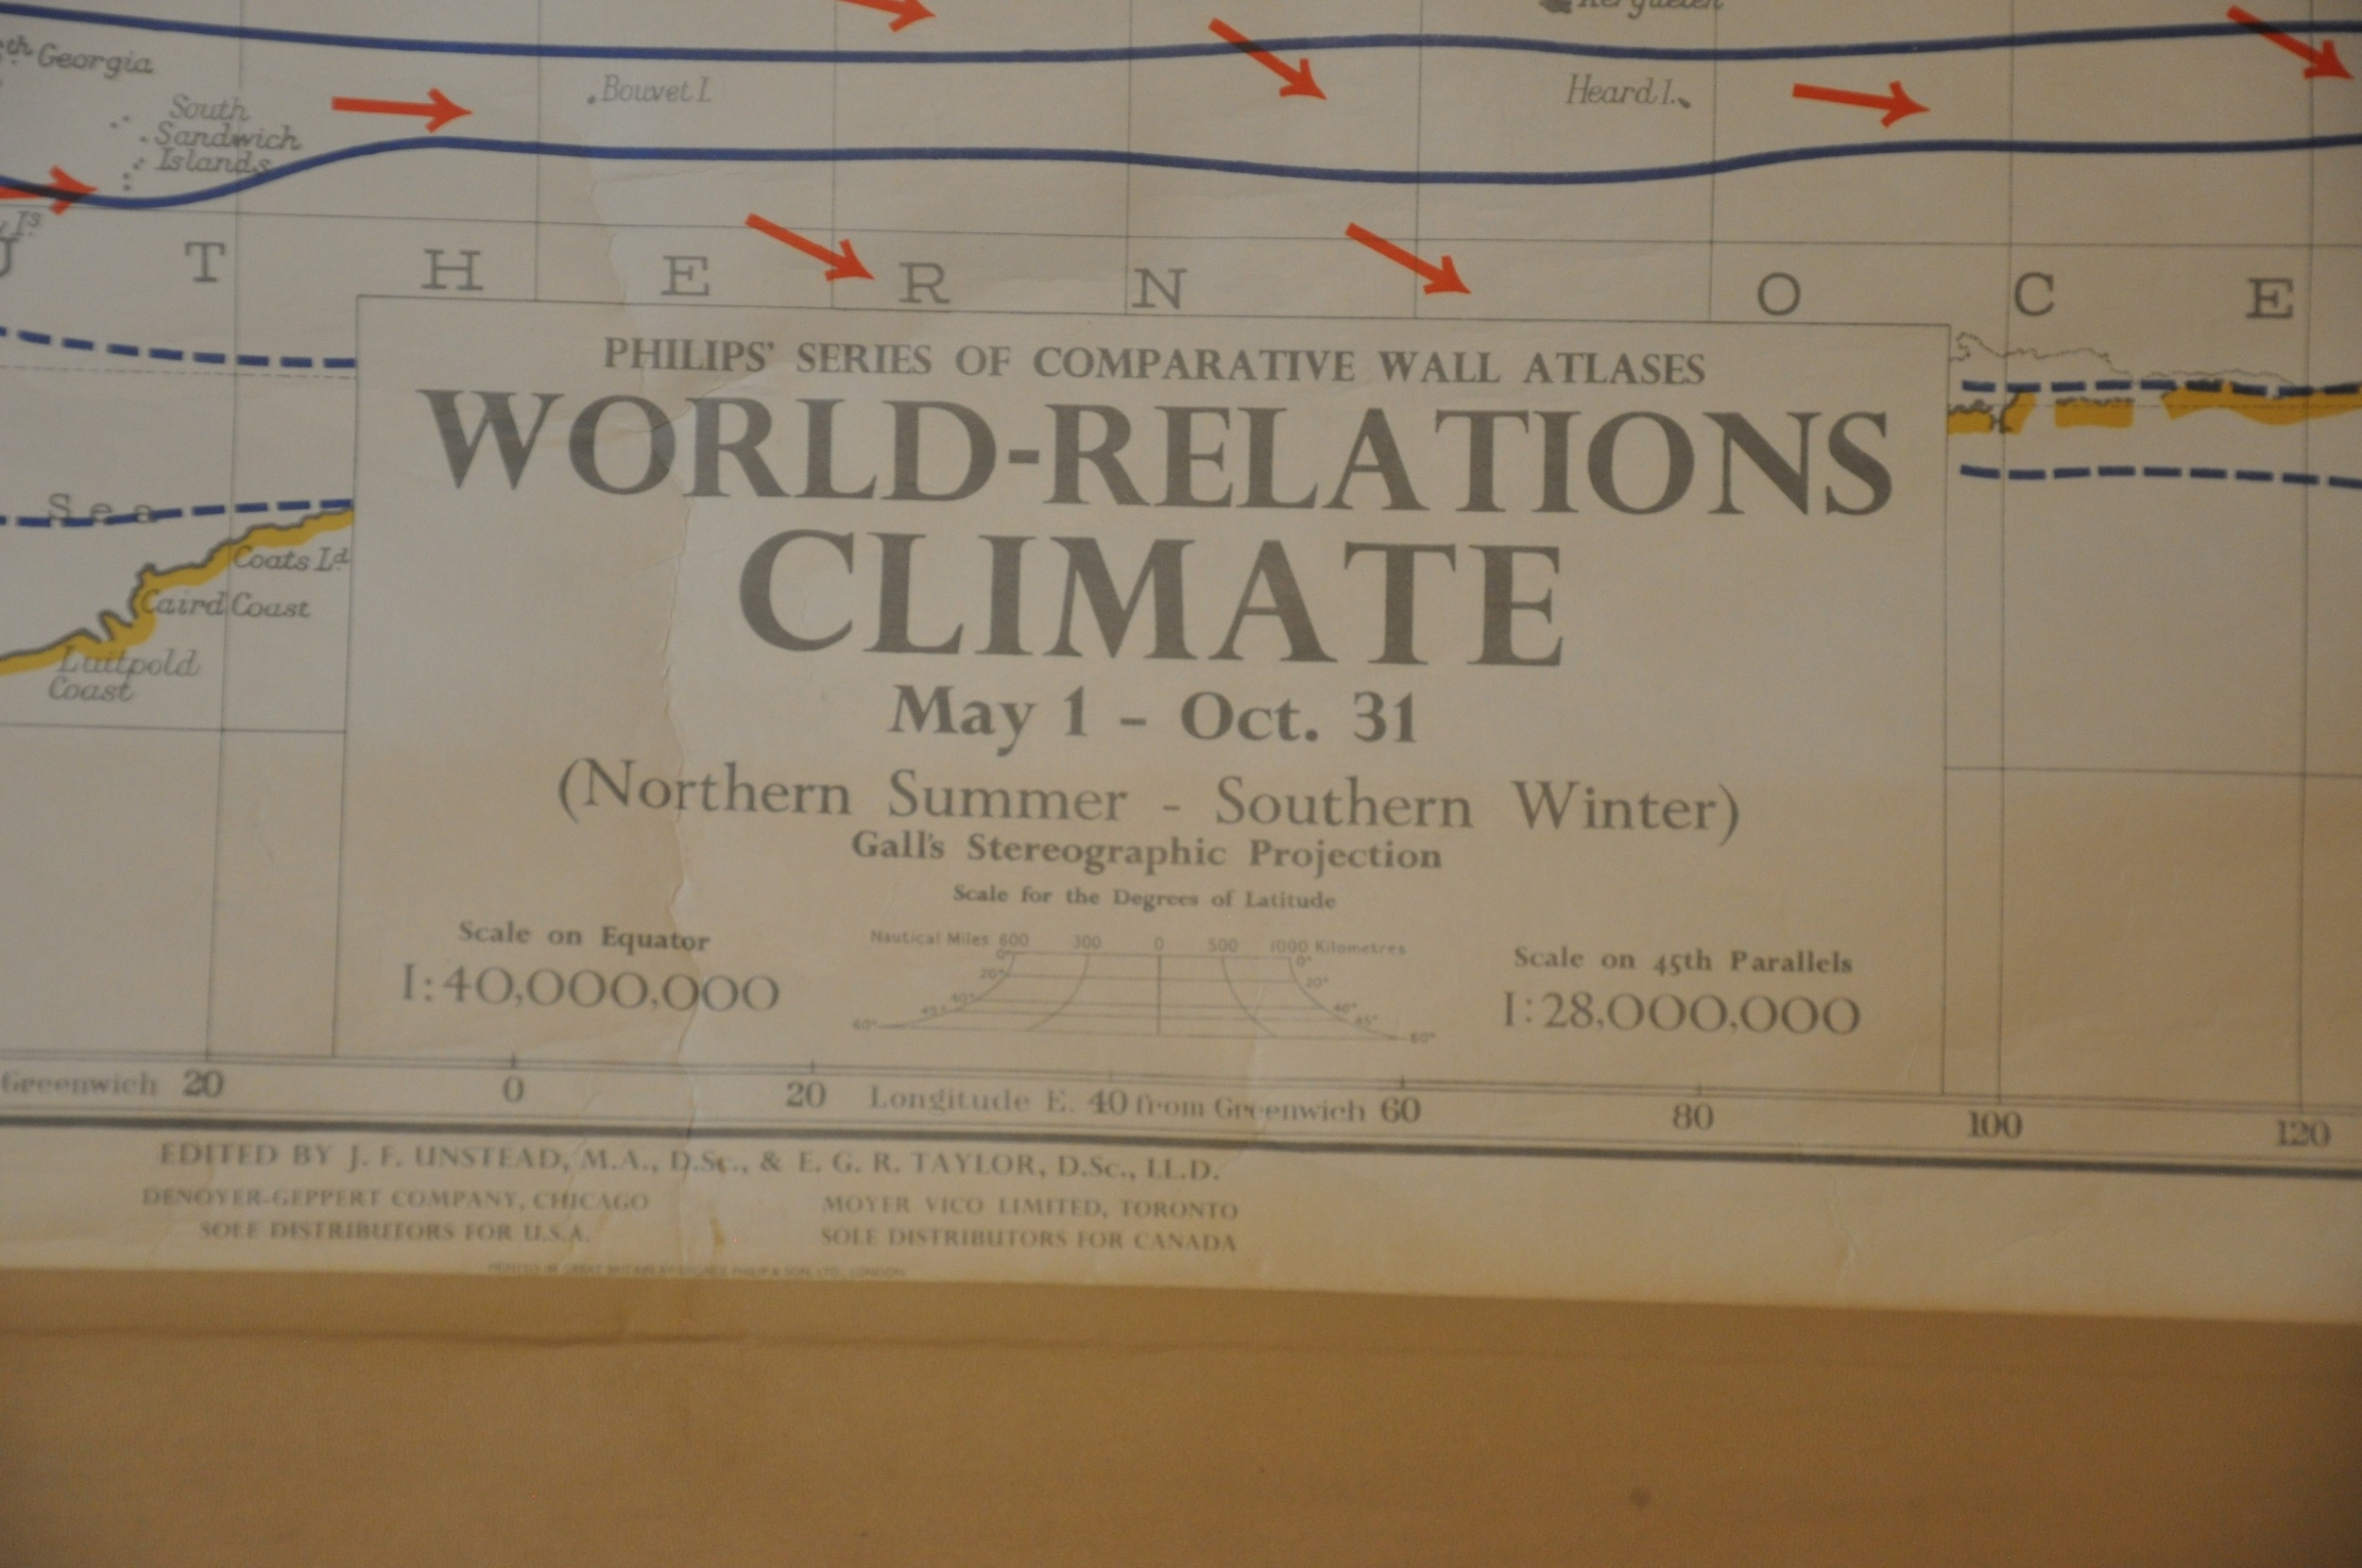
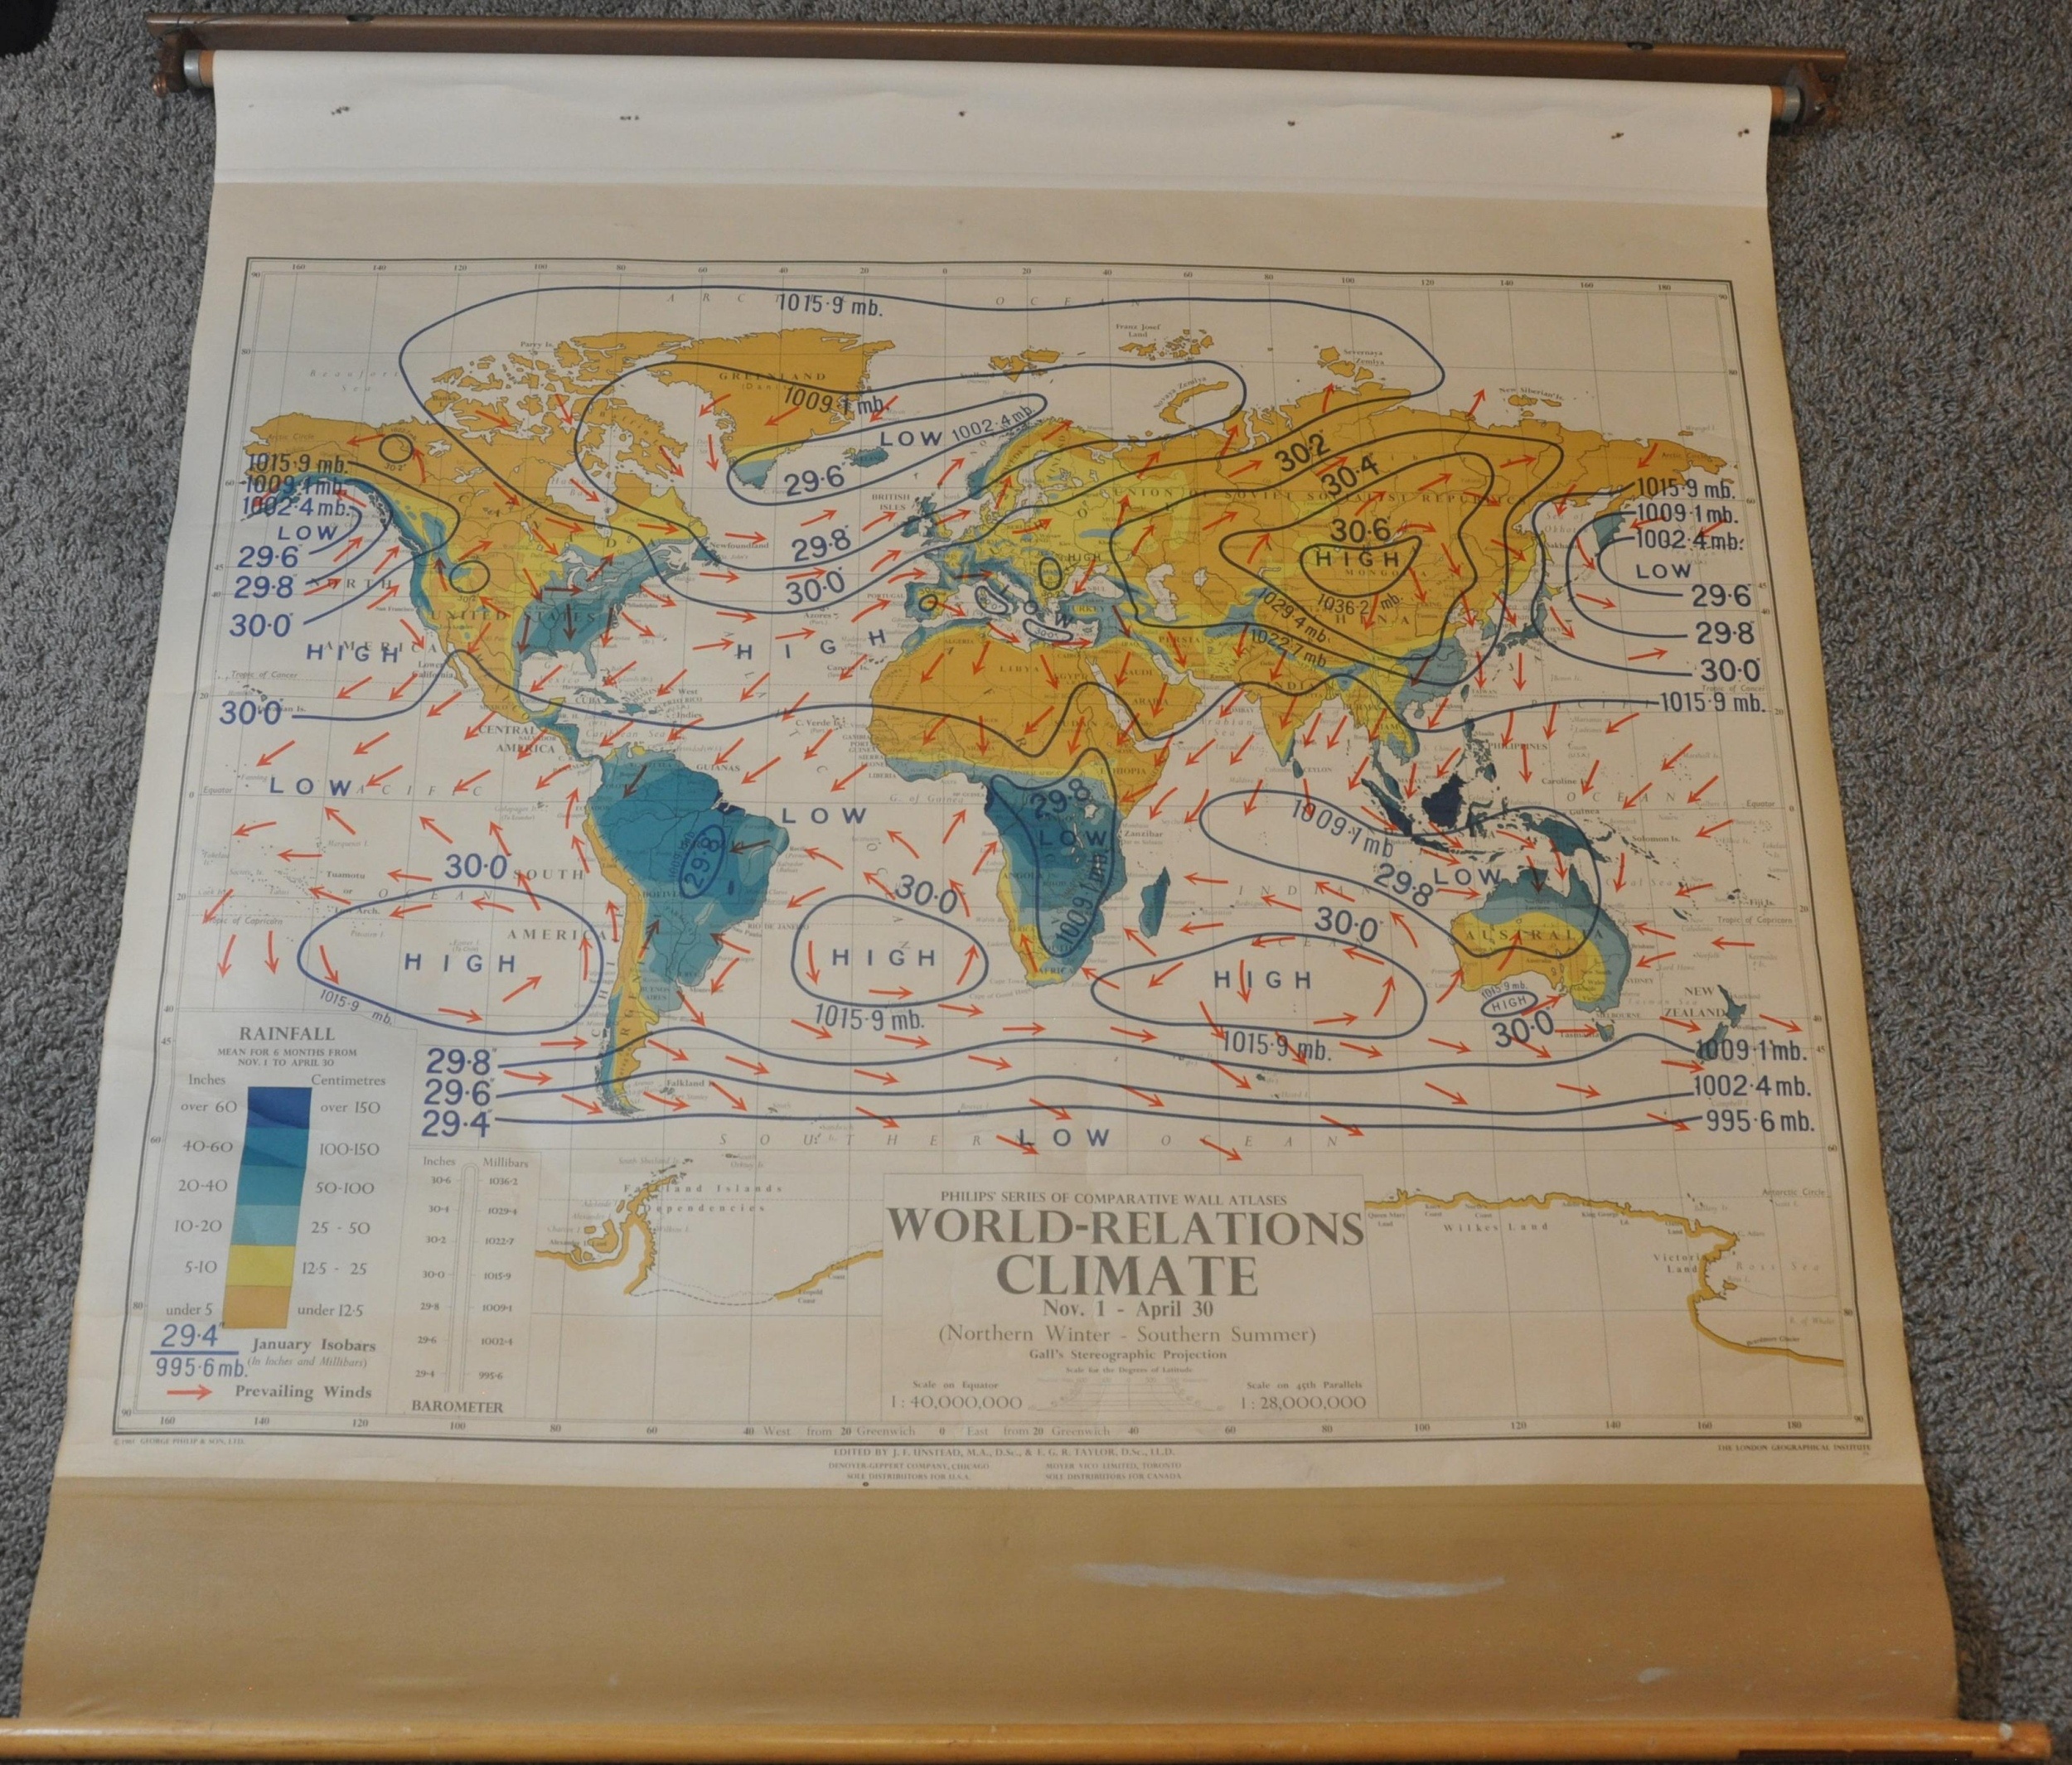
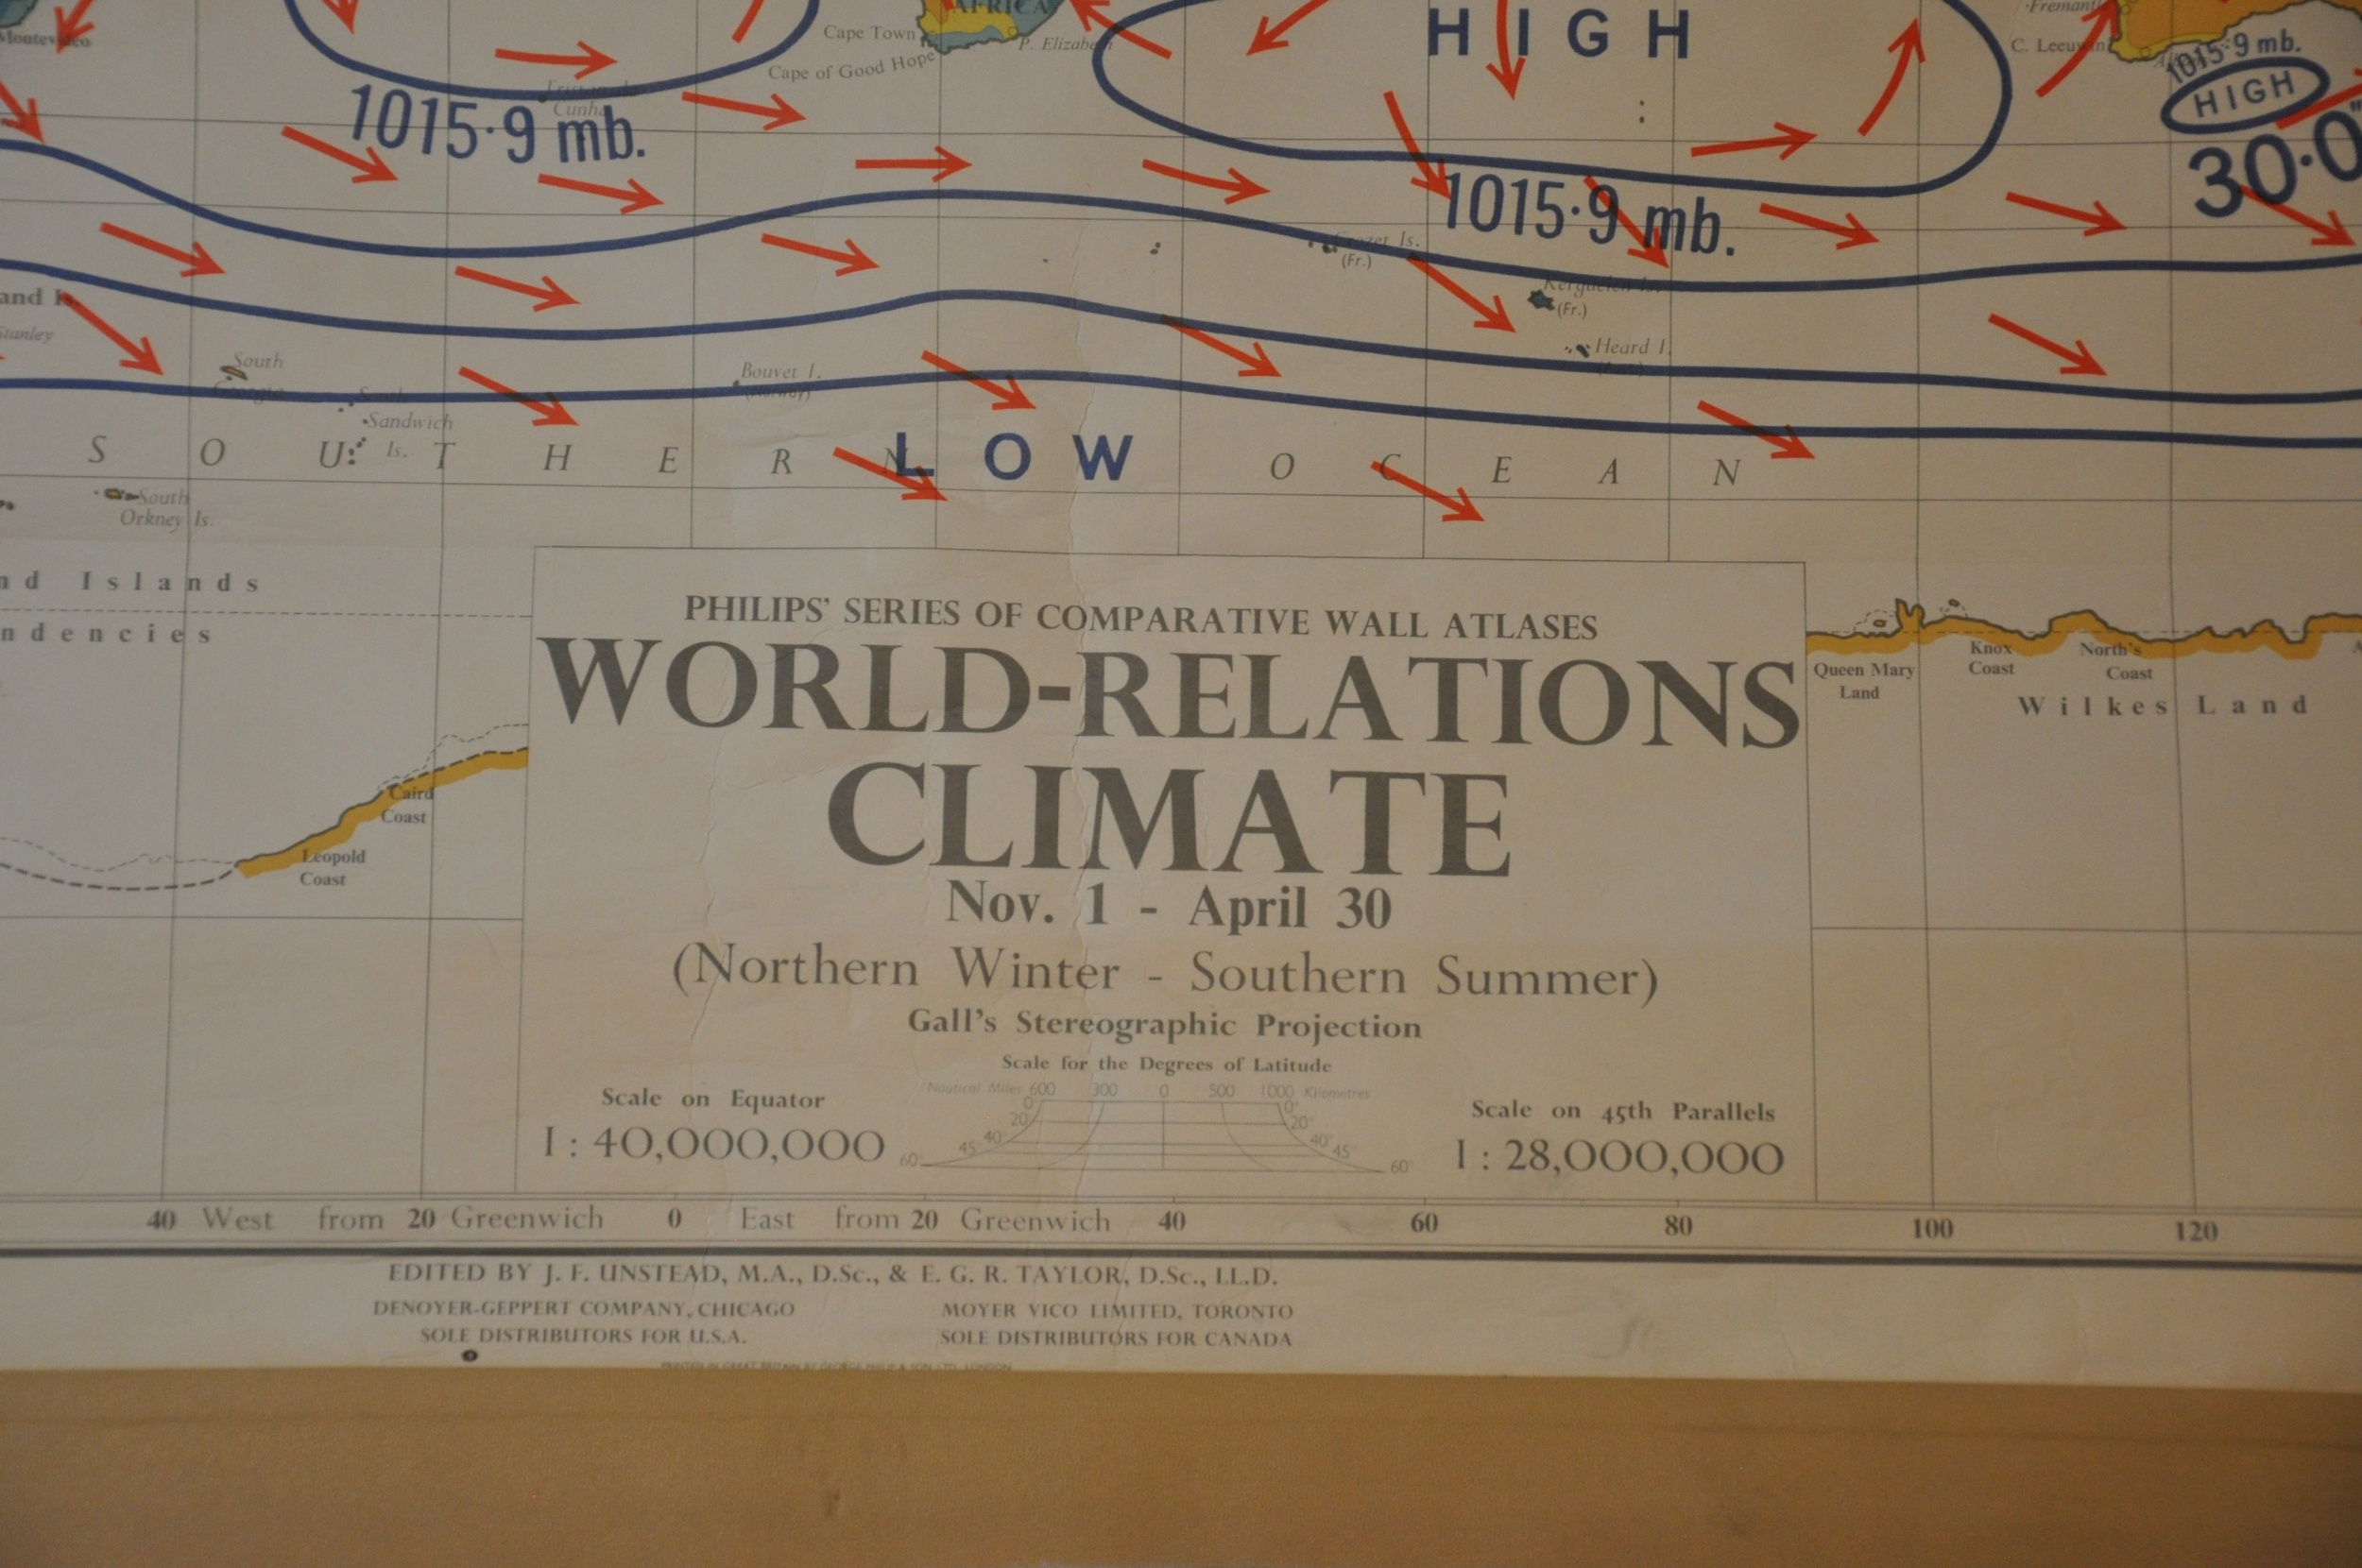
World Relations Climate May 1 – October 31 [and] Nov 1 – April 30
$450.00
Educating a classroom about global rainfall in the early 1960s.
1 in stock
Description
This large and bold pair of wall maps show the average global rainfall, general wind directions, and bands of air pressure across the world on Gall’s Stereographic Projection. Each sheet shows data collected from approximately half of the year, between 5/1 and 10/31 and 11/1 and 4/30). Hues ranging from tan (under 5 inches) to dark blue (over 60 inches) show the dispersal of precipitation while red arrows show the prevailing winds. Barometric measurements are shown in inches and millibars, with an average July reading shown with corresponding pockets of high and low pressure.
The images were edited by J.F. Unsteady and E.G.R. Taylor and published in London in 1961 by George Philip and Son. Part of the Philips’ Series of Comparative Wall Atlases issued by the London Geographical Institute and distributed by Denoyer-Geppert in the United States.
Map Details
Publication Date: 1961
Author: The London Geographical Institute
Sheet Width (in): 43
Sheet Height (in): 34.75
Condition: A-
Condition Description: Pair of linen backed wall maps affixed to original wooden retracting rollers and wall mounts. About 4" of faint discoloration visible along the bottom of both sheets. Minor wear along the edges, consistent with age and use, and lightly creased wrinkled where previously rolled, but overall in very good, or better, condition.
$450.00
1 in stock
