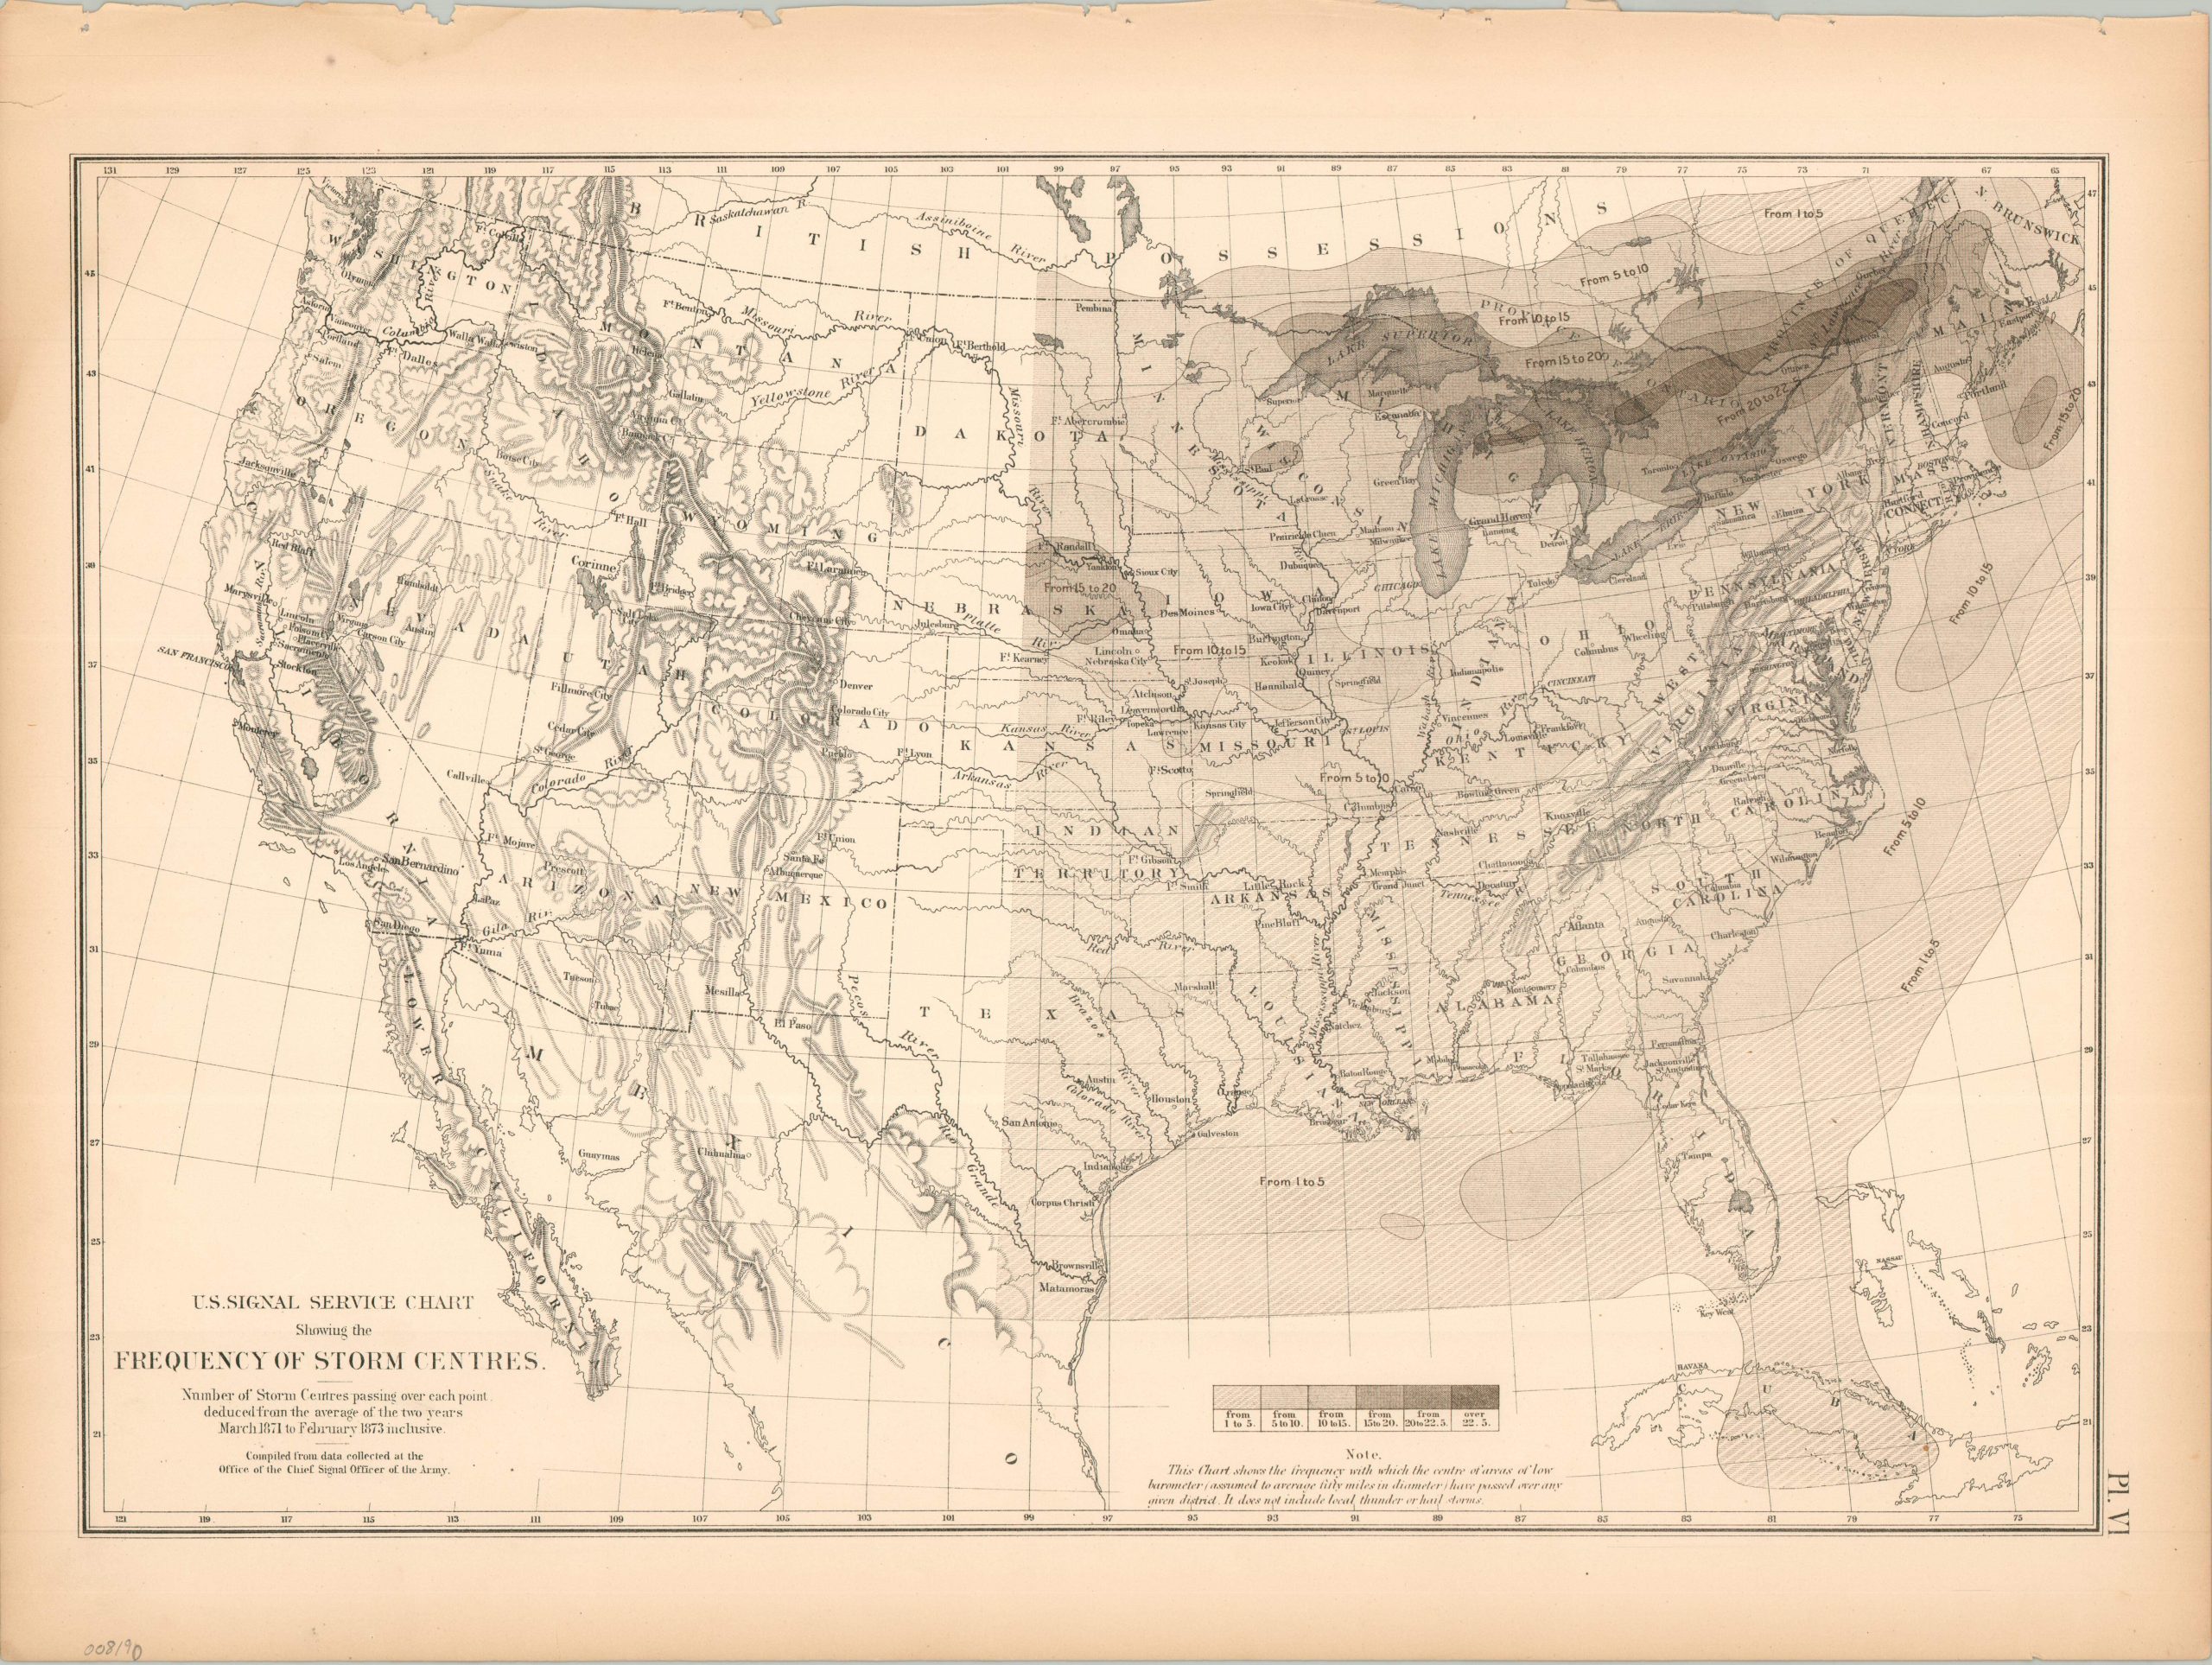
U.S. Signal Service Chart Showing the Frequency of Storm Centers
$75.00
Visualising (half) of America’s rough weather spots during the Reconstruction Era.
1 in stock
Description
This half-empty map uses shades of gray to highlight the frequency of storm centers (large-scale low-pressure systems) that passed over certain points across the eastern U.S (the region for which data was available). The available range is 1-5 (lined) to over 22.5 (the darkest). Text in the lower right notes that hail and local thunderstorms are not counted, only those low barometer readings for storms averaging 50 miles in diameter. Heavy concentrations are shown across the Great Lakes, the St. Lawrence River, and in the Great Plains’ ‘Tornado Alley’ (though the tracked storms would have been extratropical cyclones).
The map was originally issued as part of The Statistical Atlas of the United States Based on the Results of the Ninth Census, 1870, compiled by Census Superintendent Francis A. Walker. Lithographed by Julius Bien and published in 1874. The atlas serves as the ultimate 19th-century “data portrait” of a reunified nation, meticulously synthesizing geography, climate, and demographics into a visual manifesto of America’s industrial and economic potential.
Map Details
Publication Date: 1874
Author: Francis A. Walker
Sheet Width (in): 21.75
Sheet Height (in): 16.25
Condition: B+
Condition Description: Lithographed sheet on somewhat brittle paper. Moderate marginal wear including a ragged upper edge, toning, and a few small tears/chips.
$75.00
1 in stock