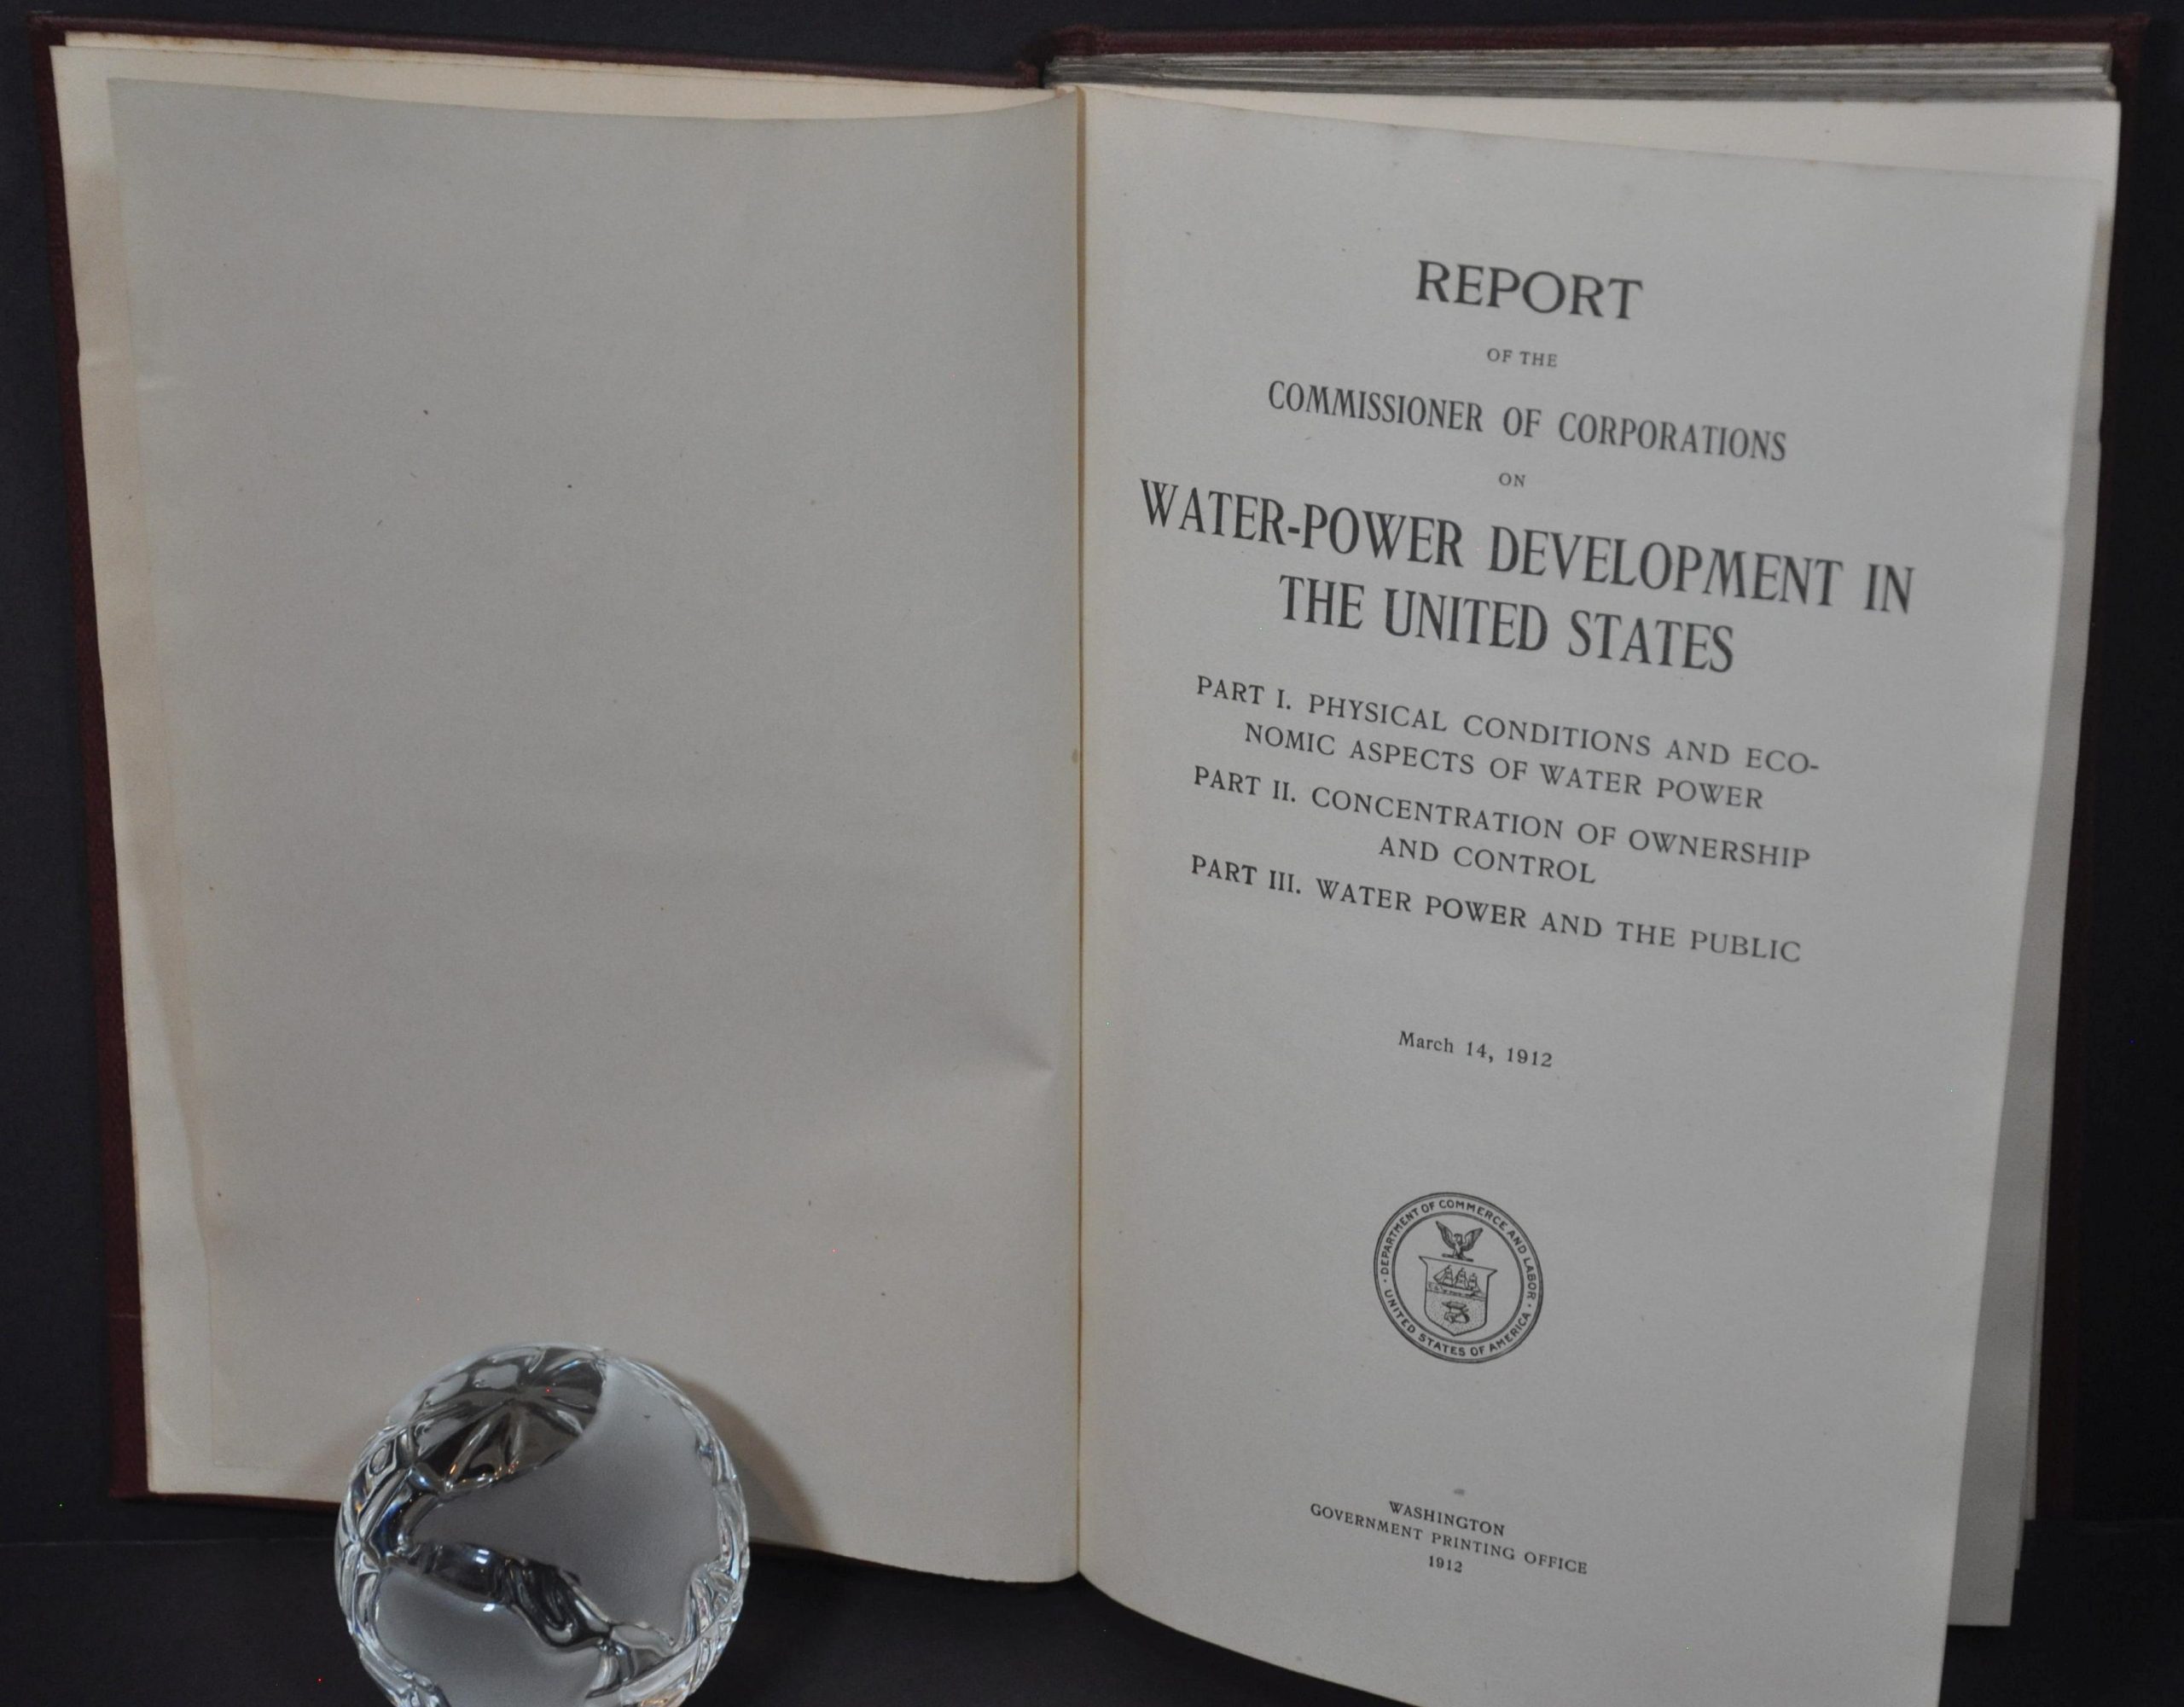
Report of the Commissioner of Corporations on Water-Power Development in the United States
$575.00
Report on hydroelectric power use in America when it accounted for nearly 20% of total energy output.
1 in stock


Description
“Within the last decade, through the development of electric transmission of power, our water-power resources have come into national importance. Power from a single source can now reach a marketing area of at least 100,000 square miles. Water power, once strictly local, has thus suddenly brought within the sweep of large economic forces. This report shows the results: 1. An increasing concentration of the control of water powers by certain large interests. 2. Extensive relationship between water-power interests, public service companies (street railway, lighting, and power concerns), and banks. 3. The need of developing our water powers as promptly and completely as practicable. Use of water power means conservation of fuel. 4. The need for a definite public policy with respect to water powers. The effective means of applying such policy is through the control of the power site. It can not be applied through fixing the price of water power independently of fuel power.” [pg. xv]
The first hydroelectric power plants in the United States were constructed during the 1880s in several cities around the Great Lakes. Generally, initial uses were for electric lighting and to power mills, but the development of the alternating current system during the late 1890s allowed for the transmission of electricity over much longer distances. It was at this point that the use of hydroelectric power drastically rose across America, ultimately accounting for 6 million of the approximately 30 million horsepower produced around the nation in 1912.
It was in that year that this report on the development of water power in the United States was issued in Washington, D.C. by the Commissioner of Corporations (a forerunner of the FTC). In addition to outlining policy recommendations, financial details, and geographic information, the volume includes seven large folding maps and charts, all of which are scarce and rarely appear on the market. A fascinating volume that captures an important component of the history of renewable energy in the United States.
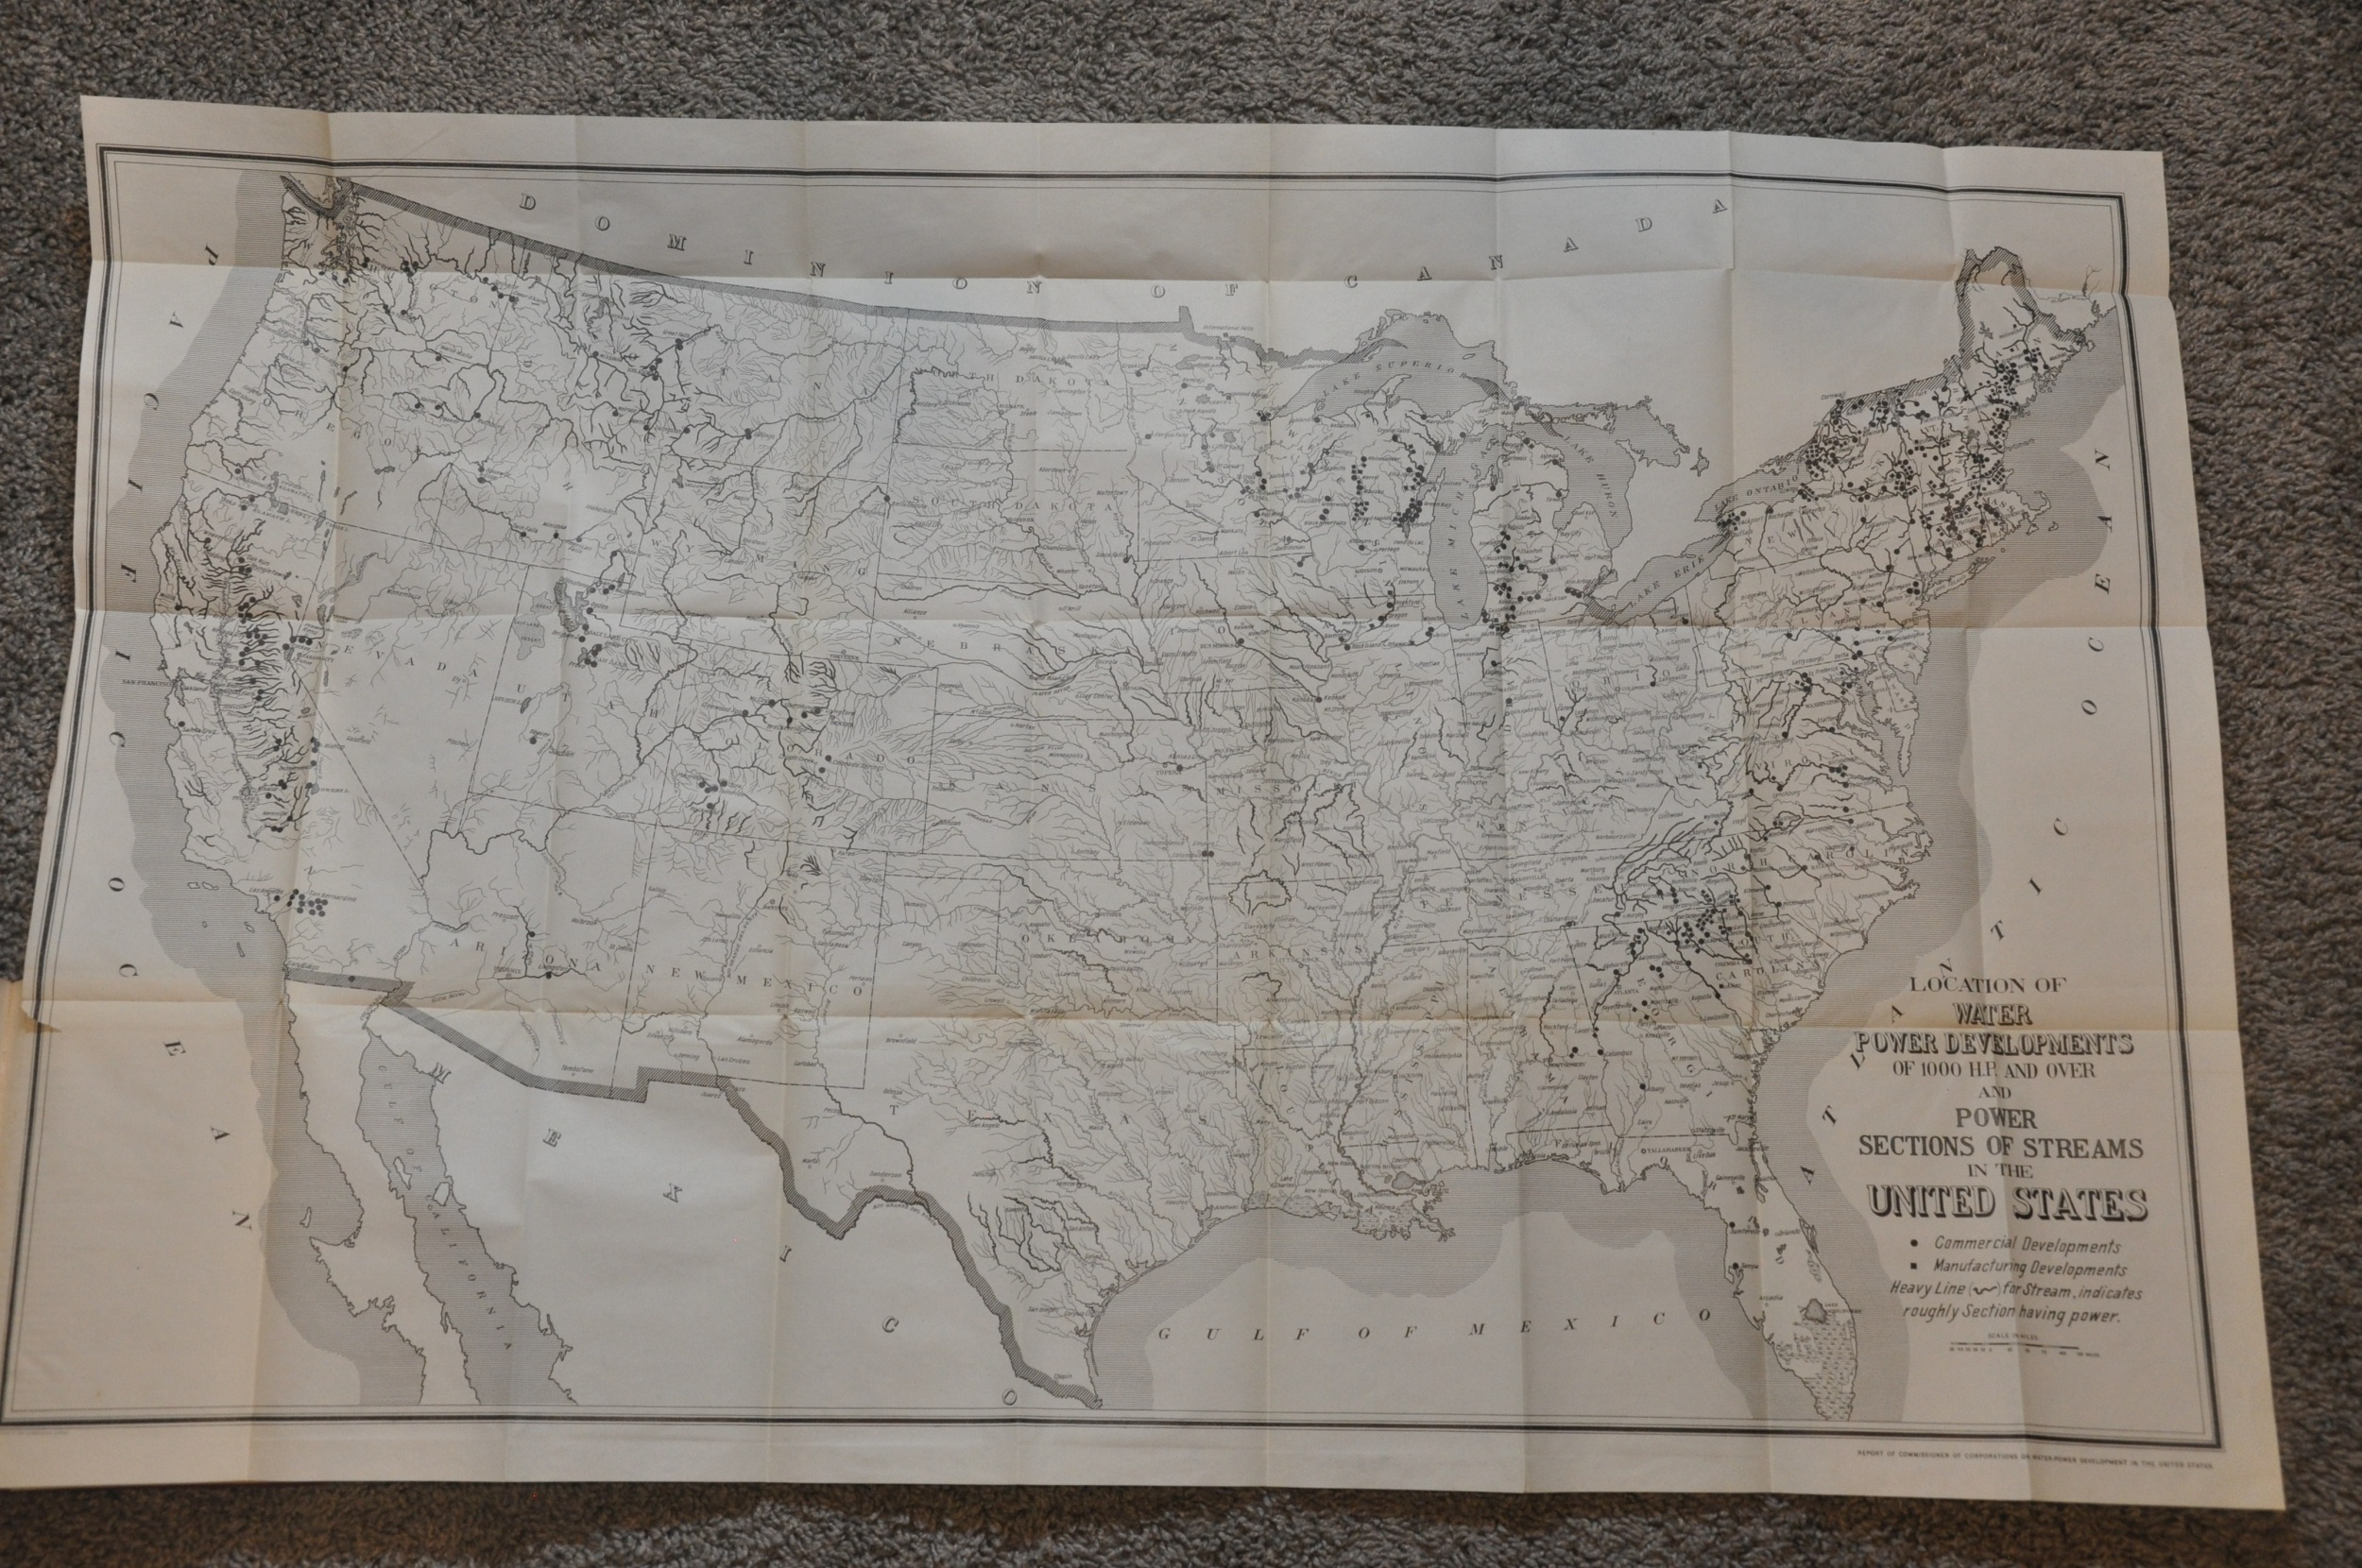
Location of Water Developments of 1000 HP and Over and Power Sections of Streams in the United States – Measures approximately 41.75″ x 26.75″ and shows the location of various commercial and manufacturing developments across America, as well as boldly highlighting the waterways where hydroelectric power generation is possible.
Two folding charts, each 29″ x 9″, that shows power production levels over a 24-hour period.
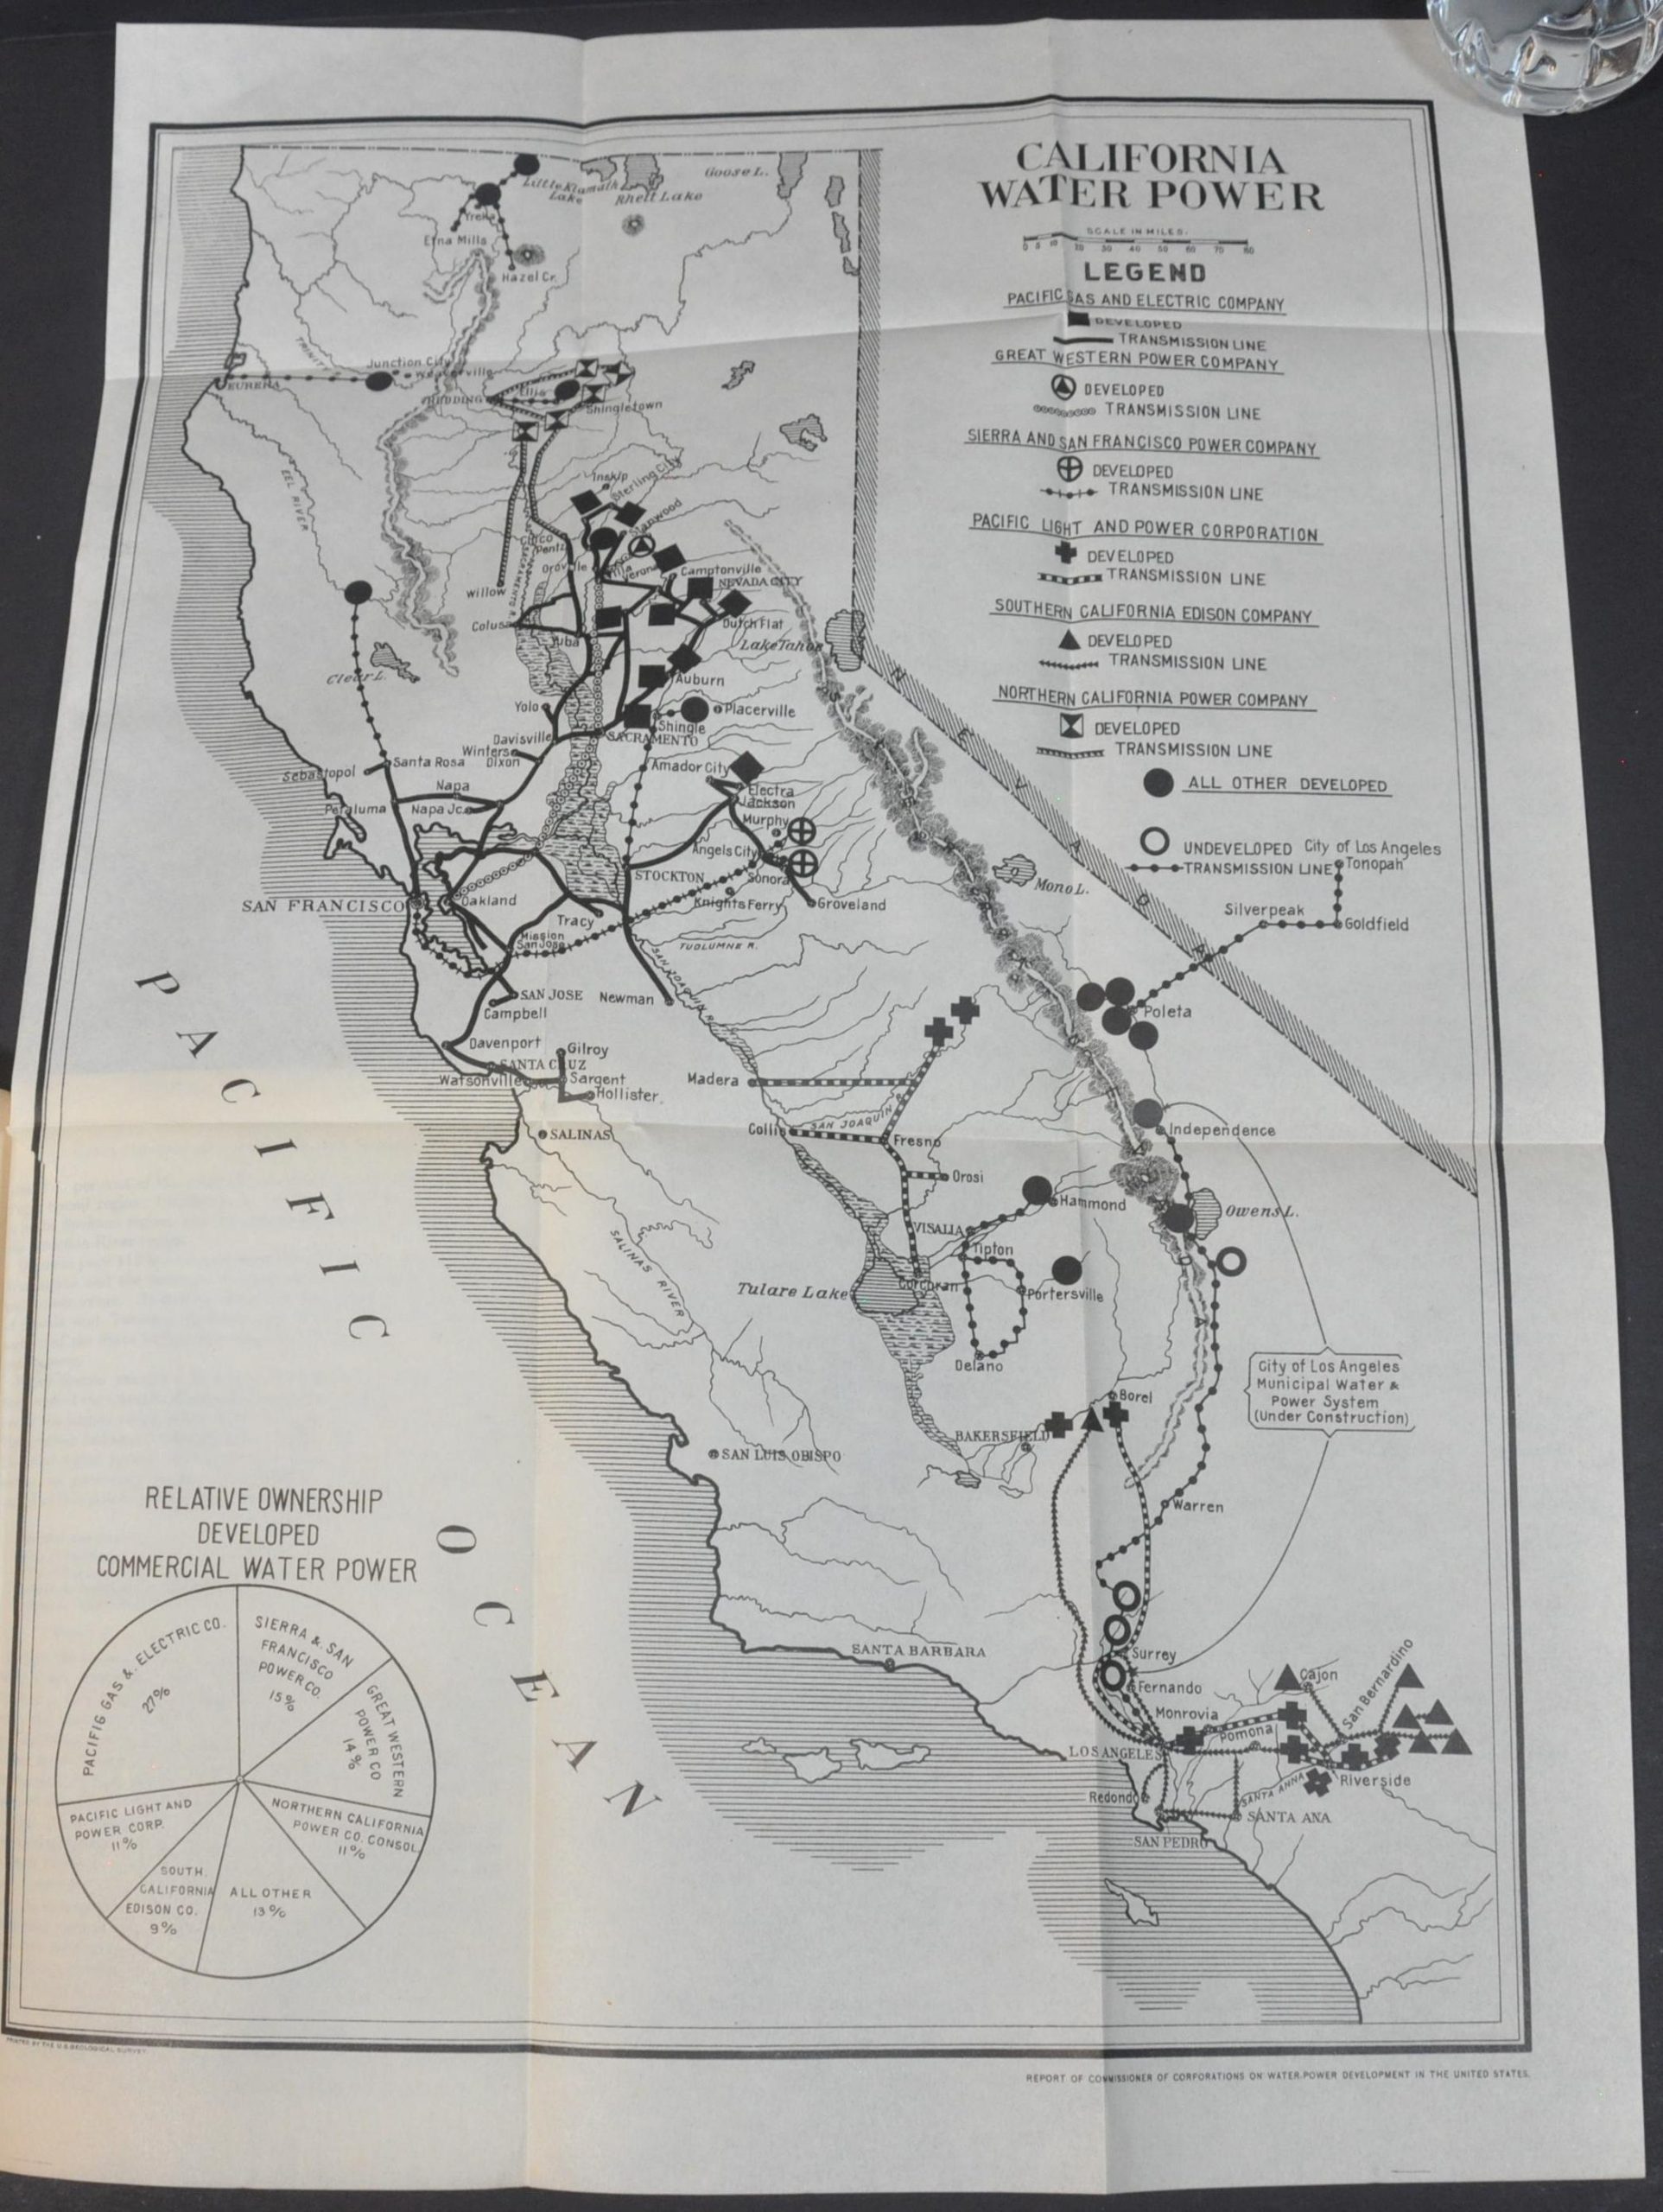
California Water Power – Measures 14″ x 19.75″ and shows the holdings of various power companies across the state. A chart in the lower left shows the relative ownership stakes, with Pacific Gas & Electric possessing over a quarter of the total developed commercial water power.
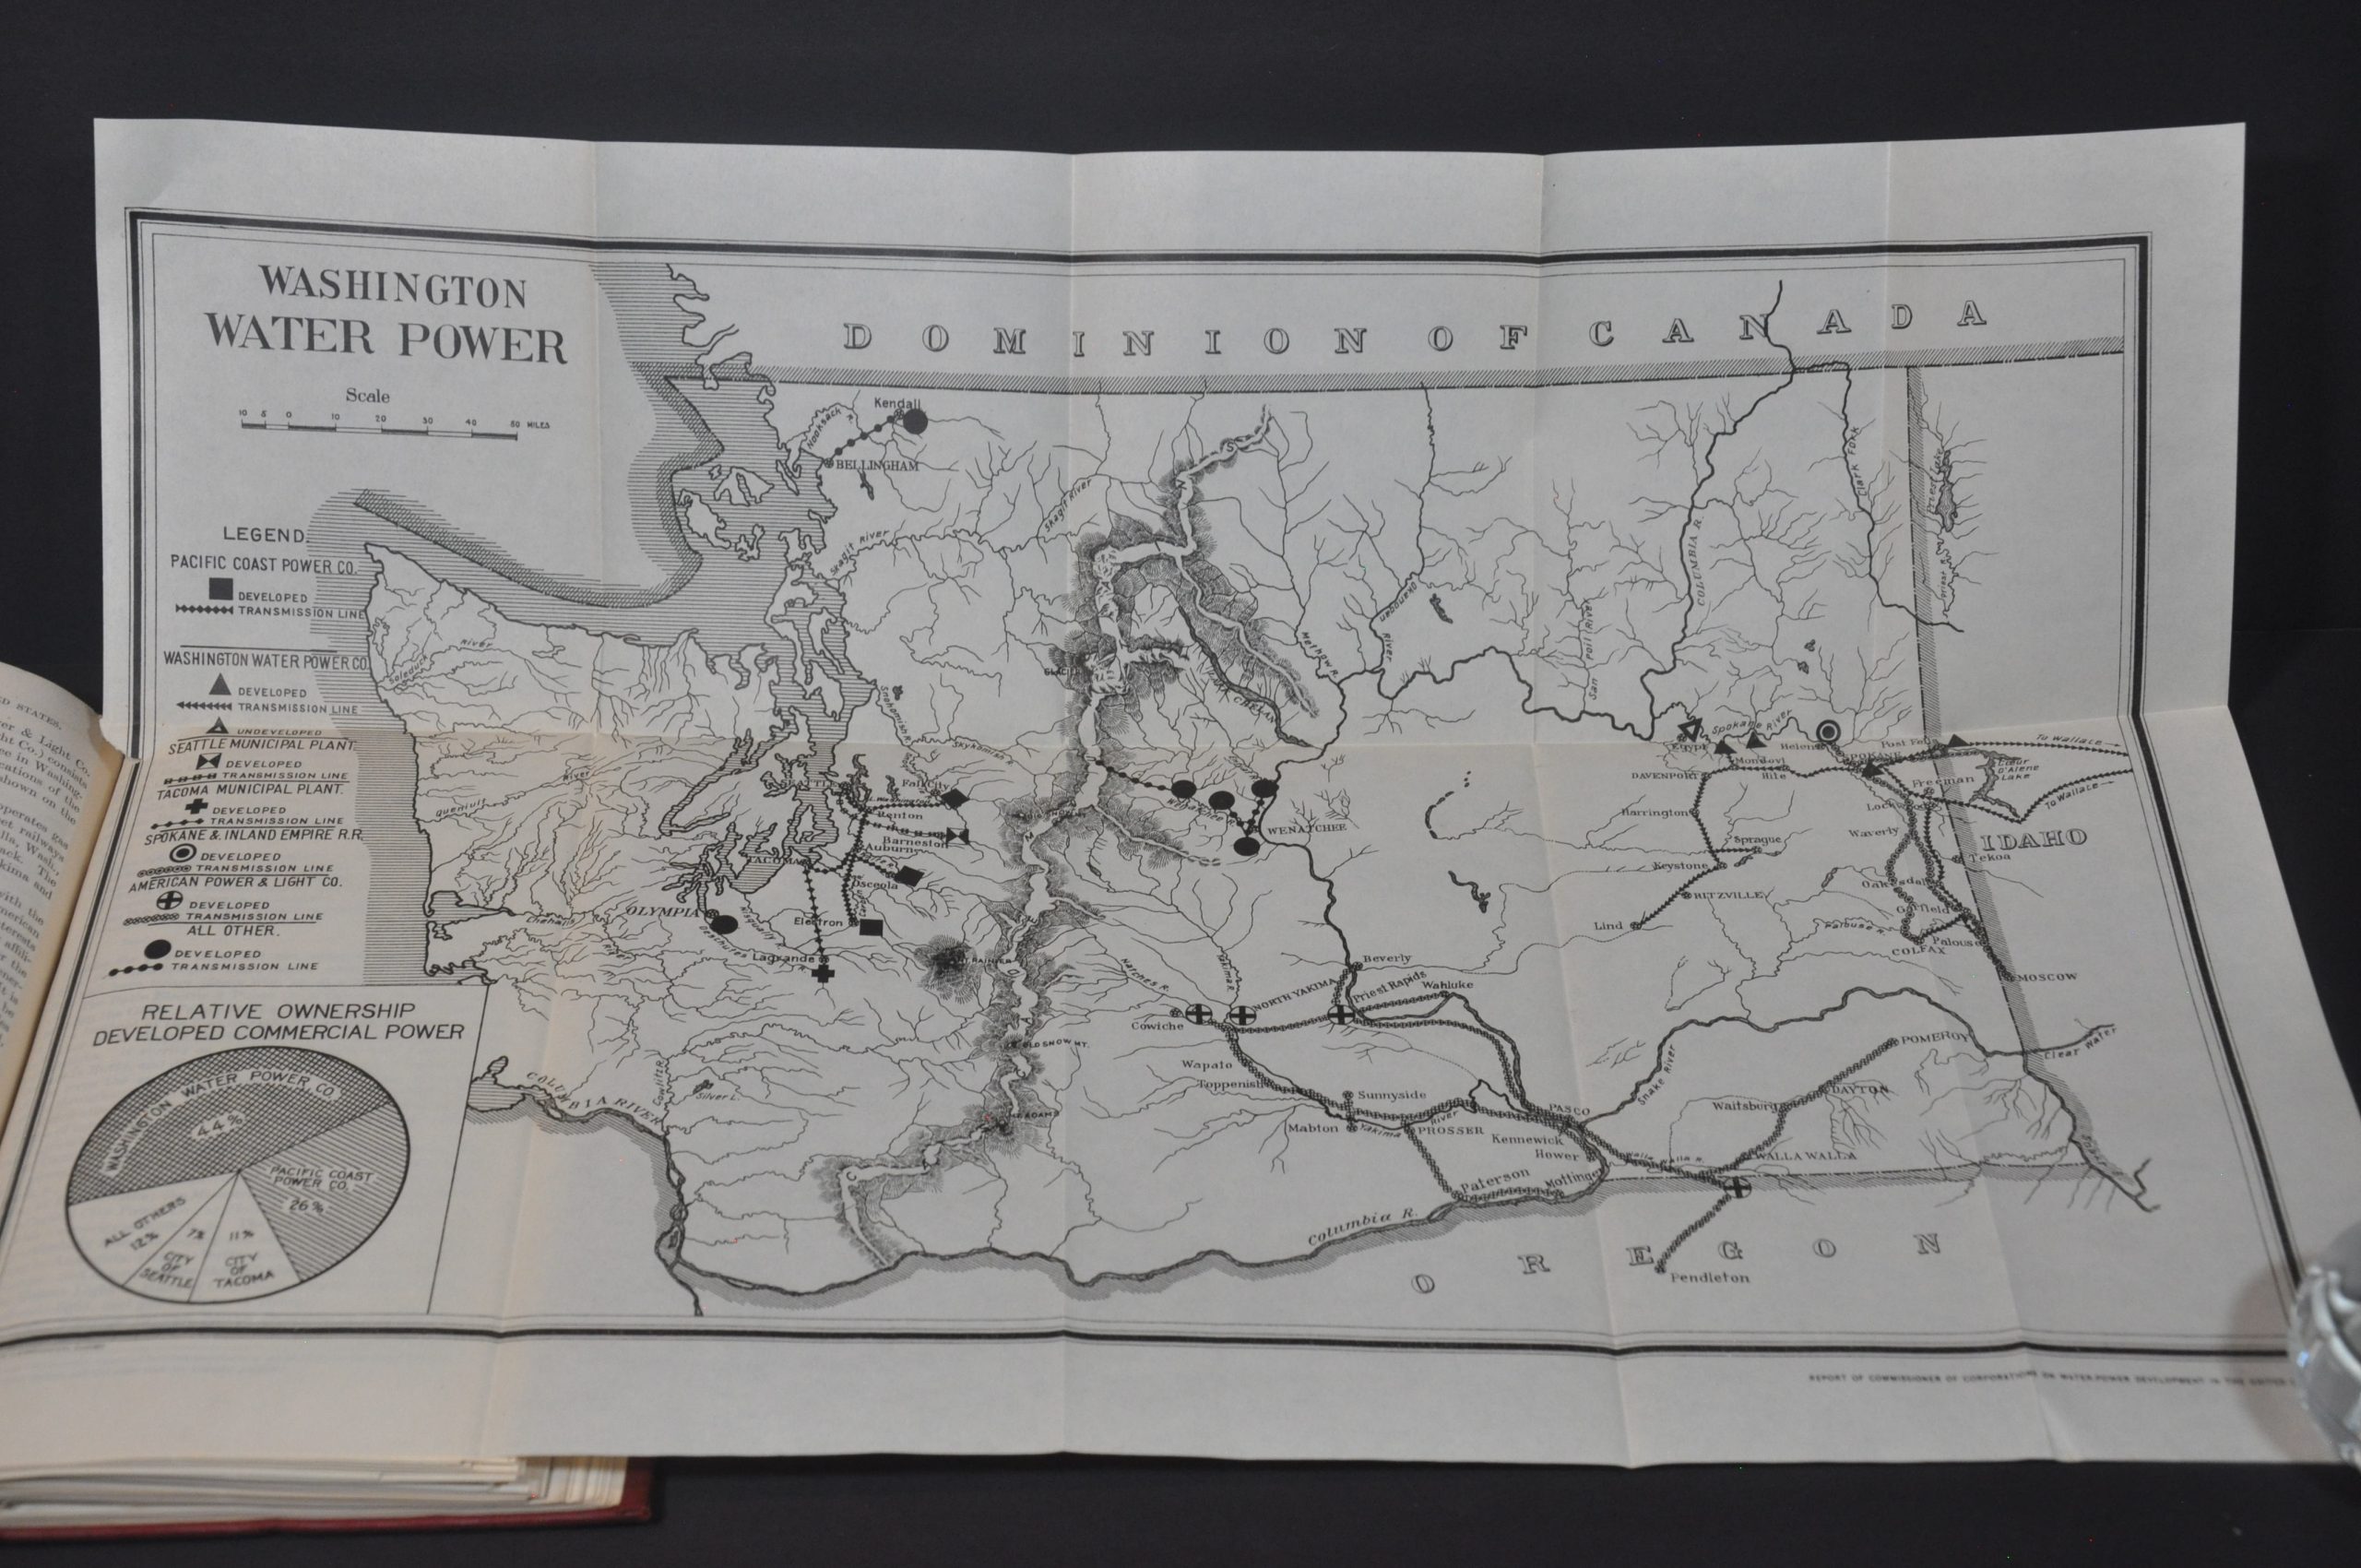
Washington Water Power – Measures 21″ x 14″ and shows the holdings of various power companies across the state. A chart in the lower left shows the relative ownership stakes, with the Washington Water Power Company possessing nearly half of the total developed commercial water power.
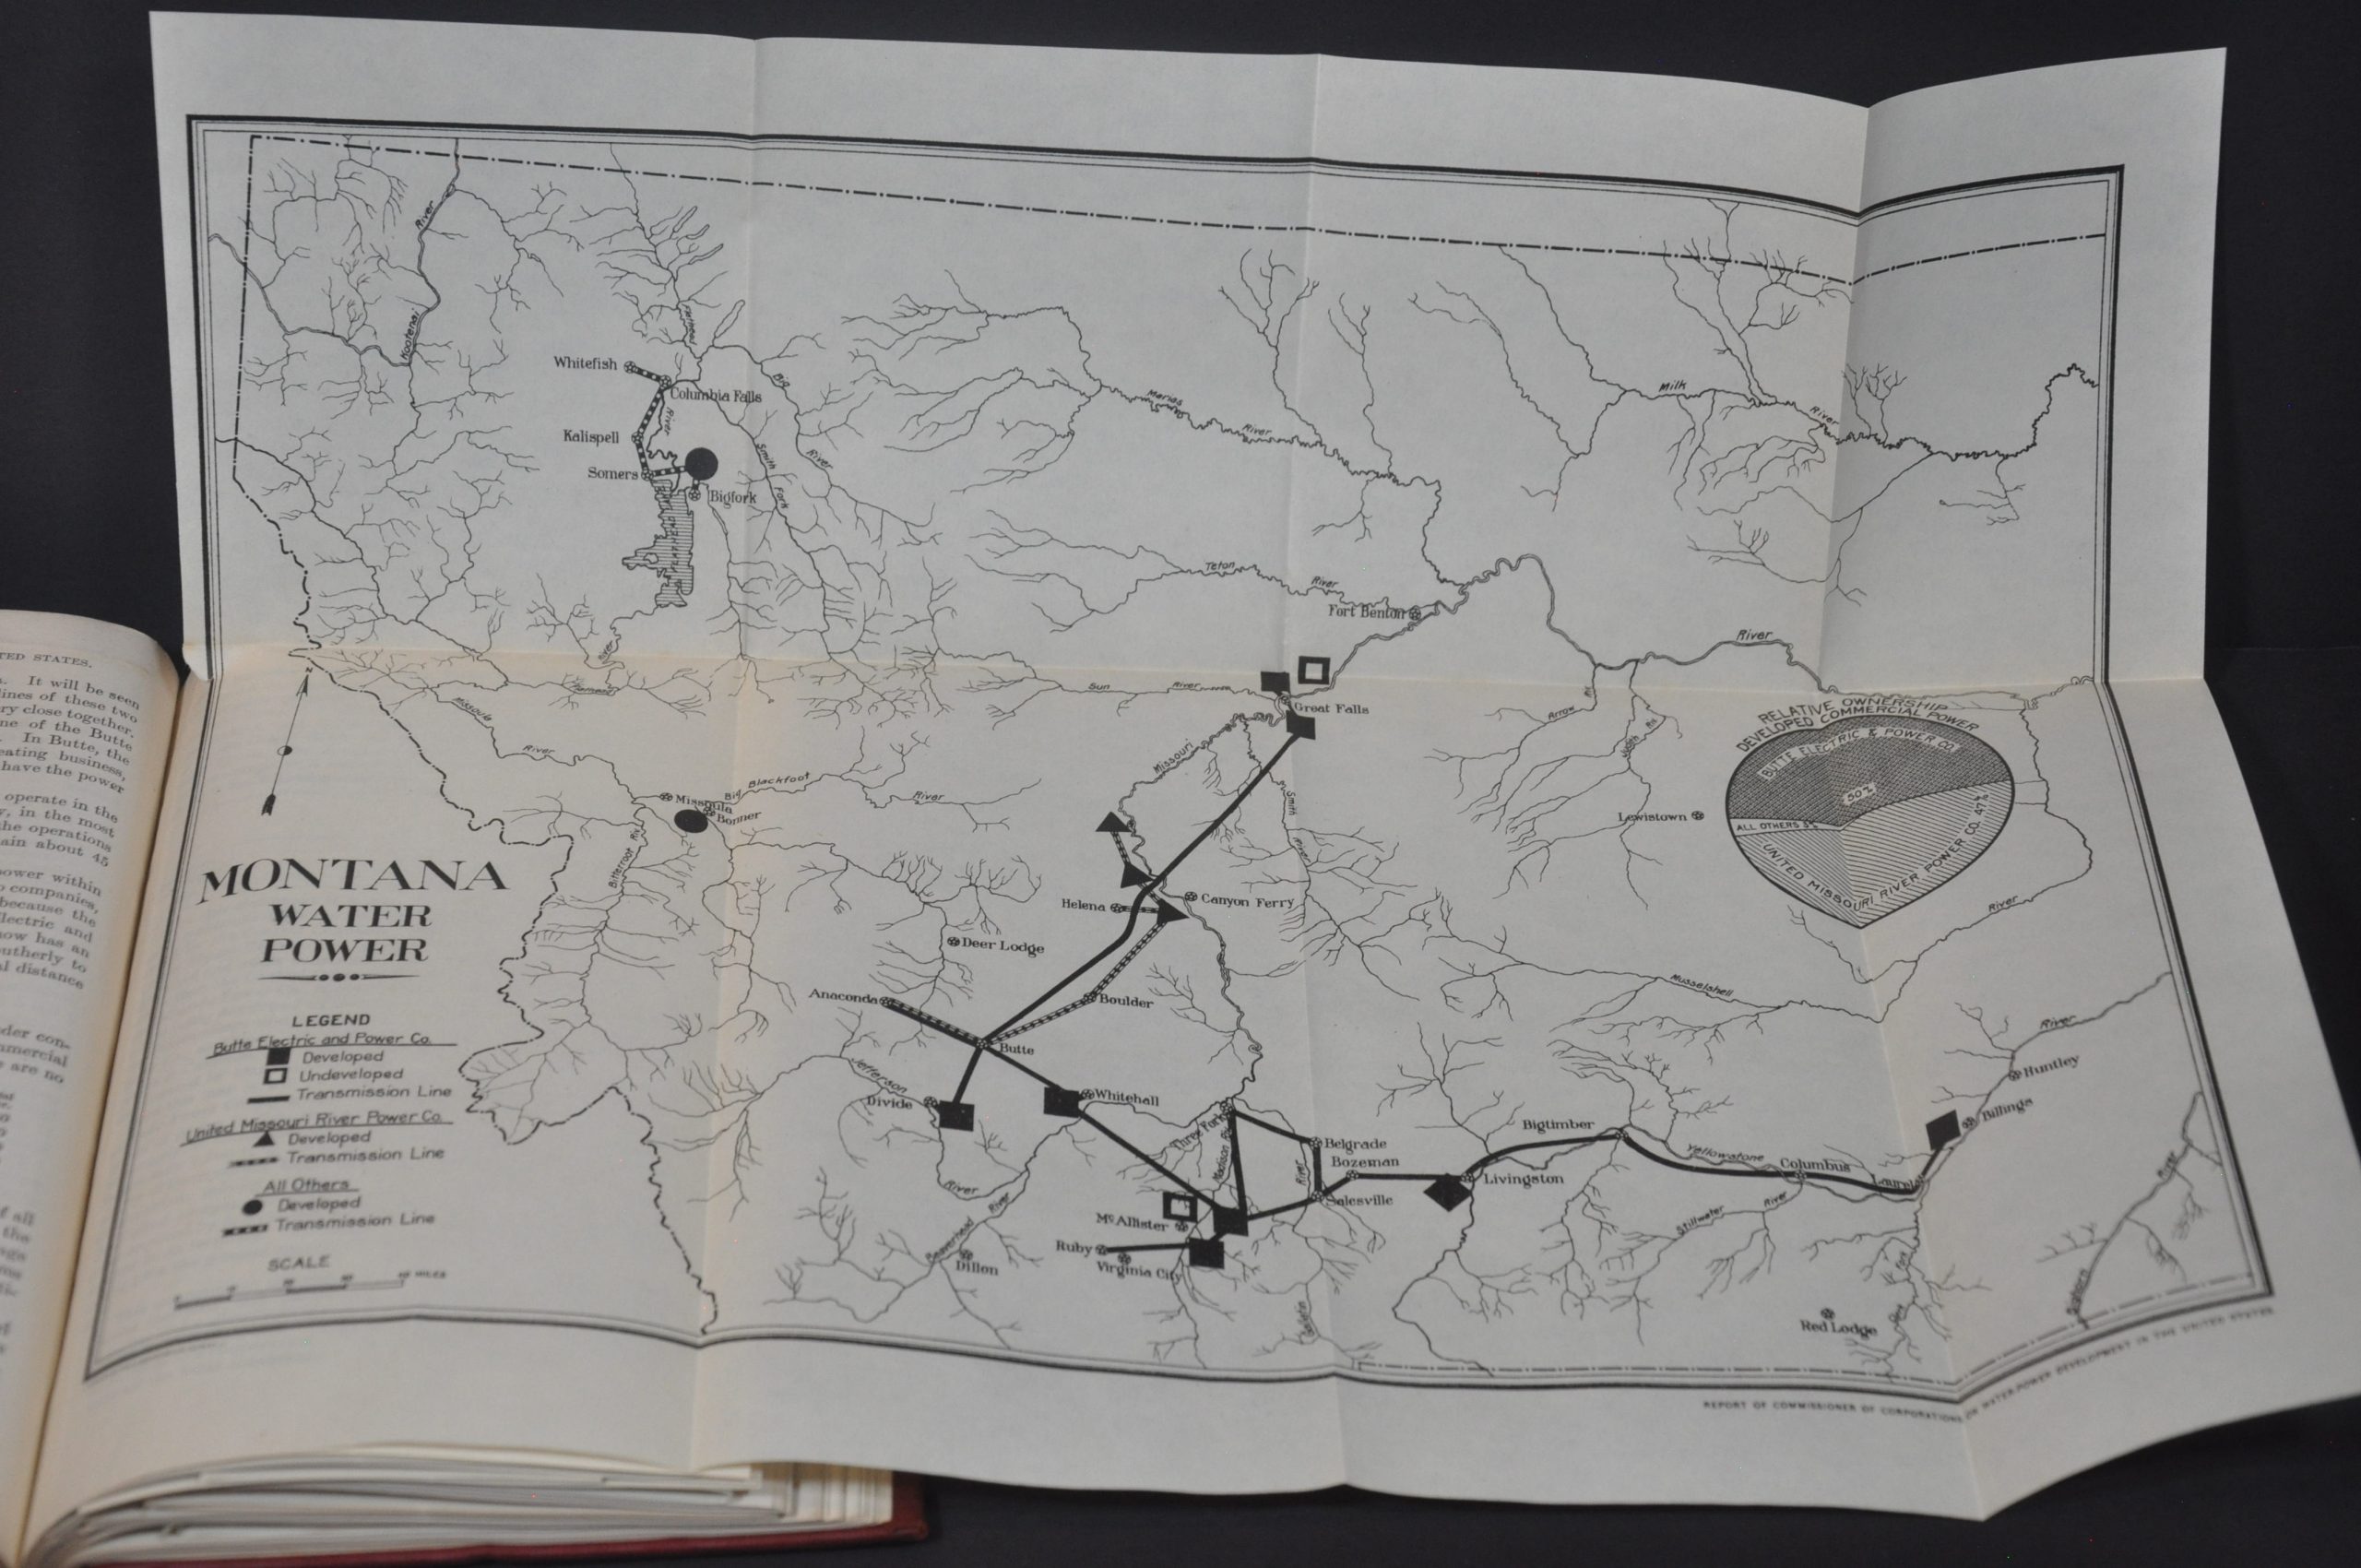
Montana Water Power – Measures 17″ x 13.5″ and shows the holdings of various power companies across the state. A chart in the lower left shows the relative ownership stakes, with the Butte Electric & Power Company and the United Missouri River Power Company sharing 97% of the developed commercial water power.
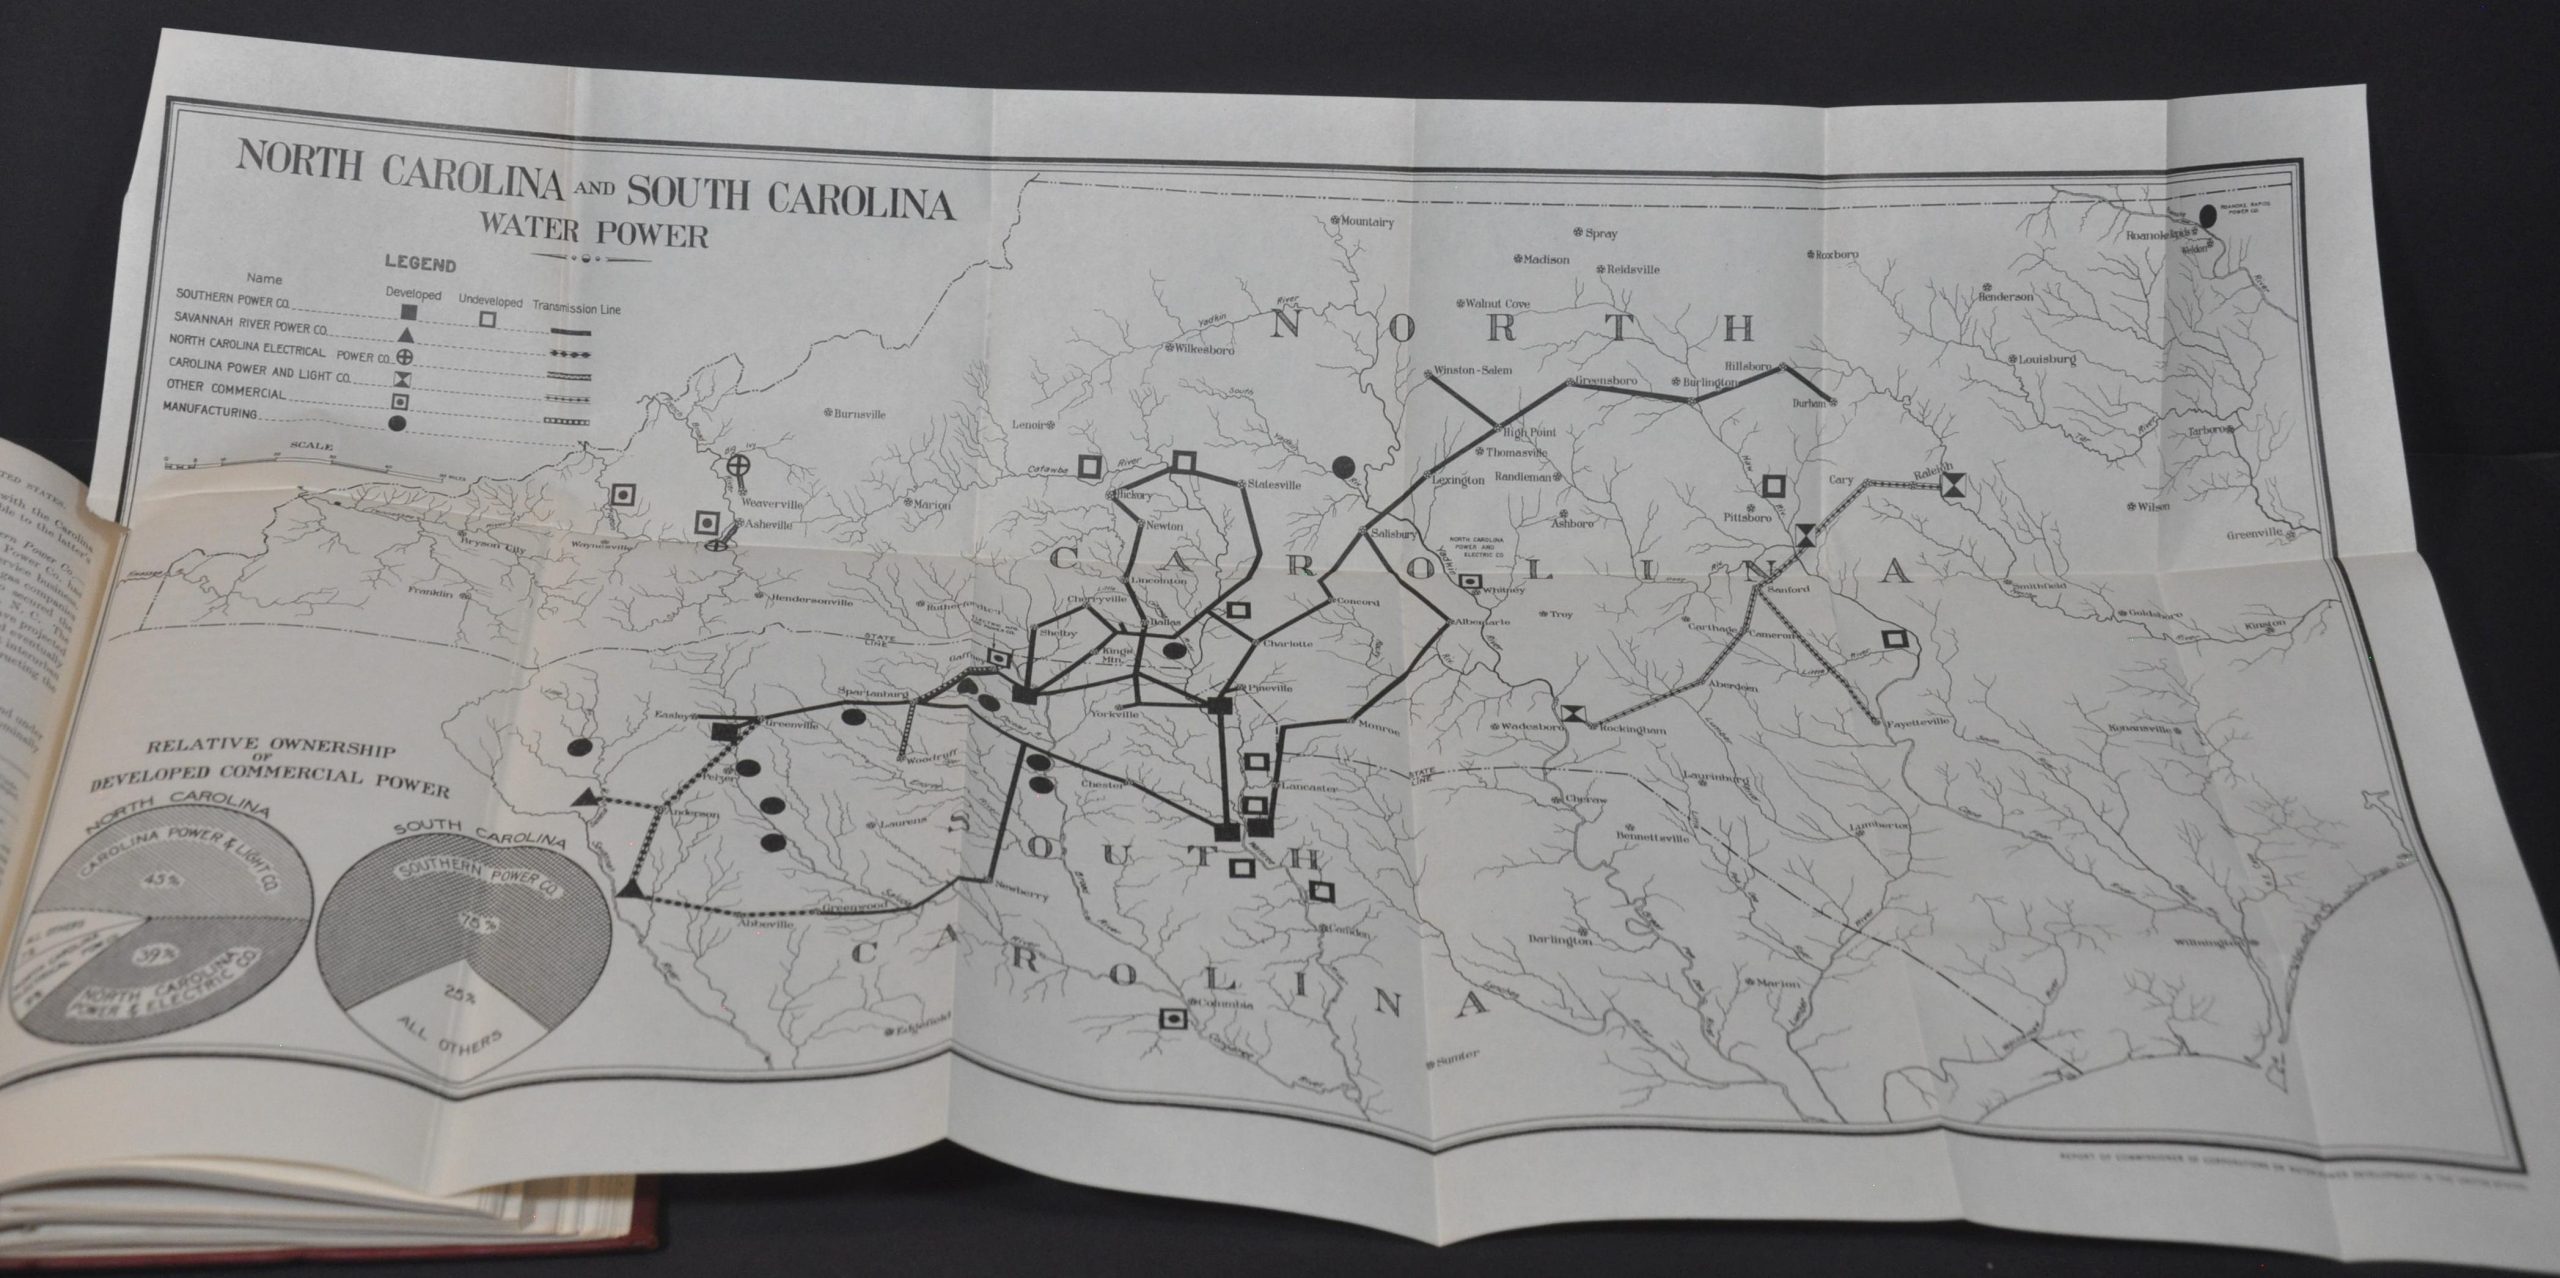
North and South Carolina Water Power – Measures 25″ x 13.5″ and shows the holdings of various power companies across the Carolinas. A chart in the lower left shows the relative ownership stakes, with three major organizations dominating the relative ownership of developed commercial power.
Michigan Southern Peninsula Water Power – Measures 12.5″ x 9″ and shows the holdings of various power companies across Michigan’s Lower Peninsula. A chart in the upper left shows the relative ownership stakes, with Commonwealth Power Railway and Light Company possessing over 75% of developed commercial power.
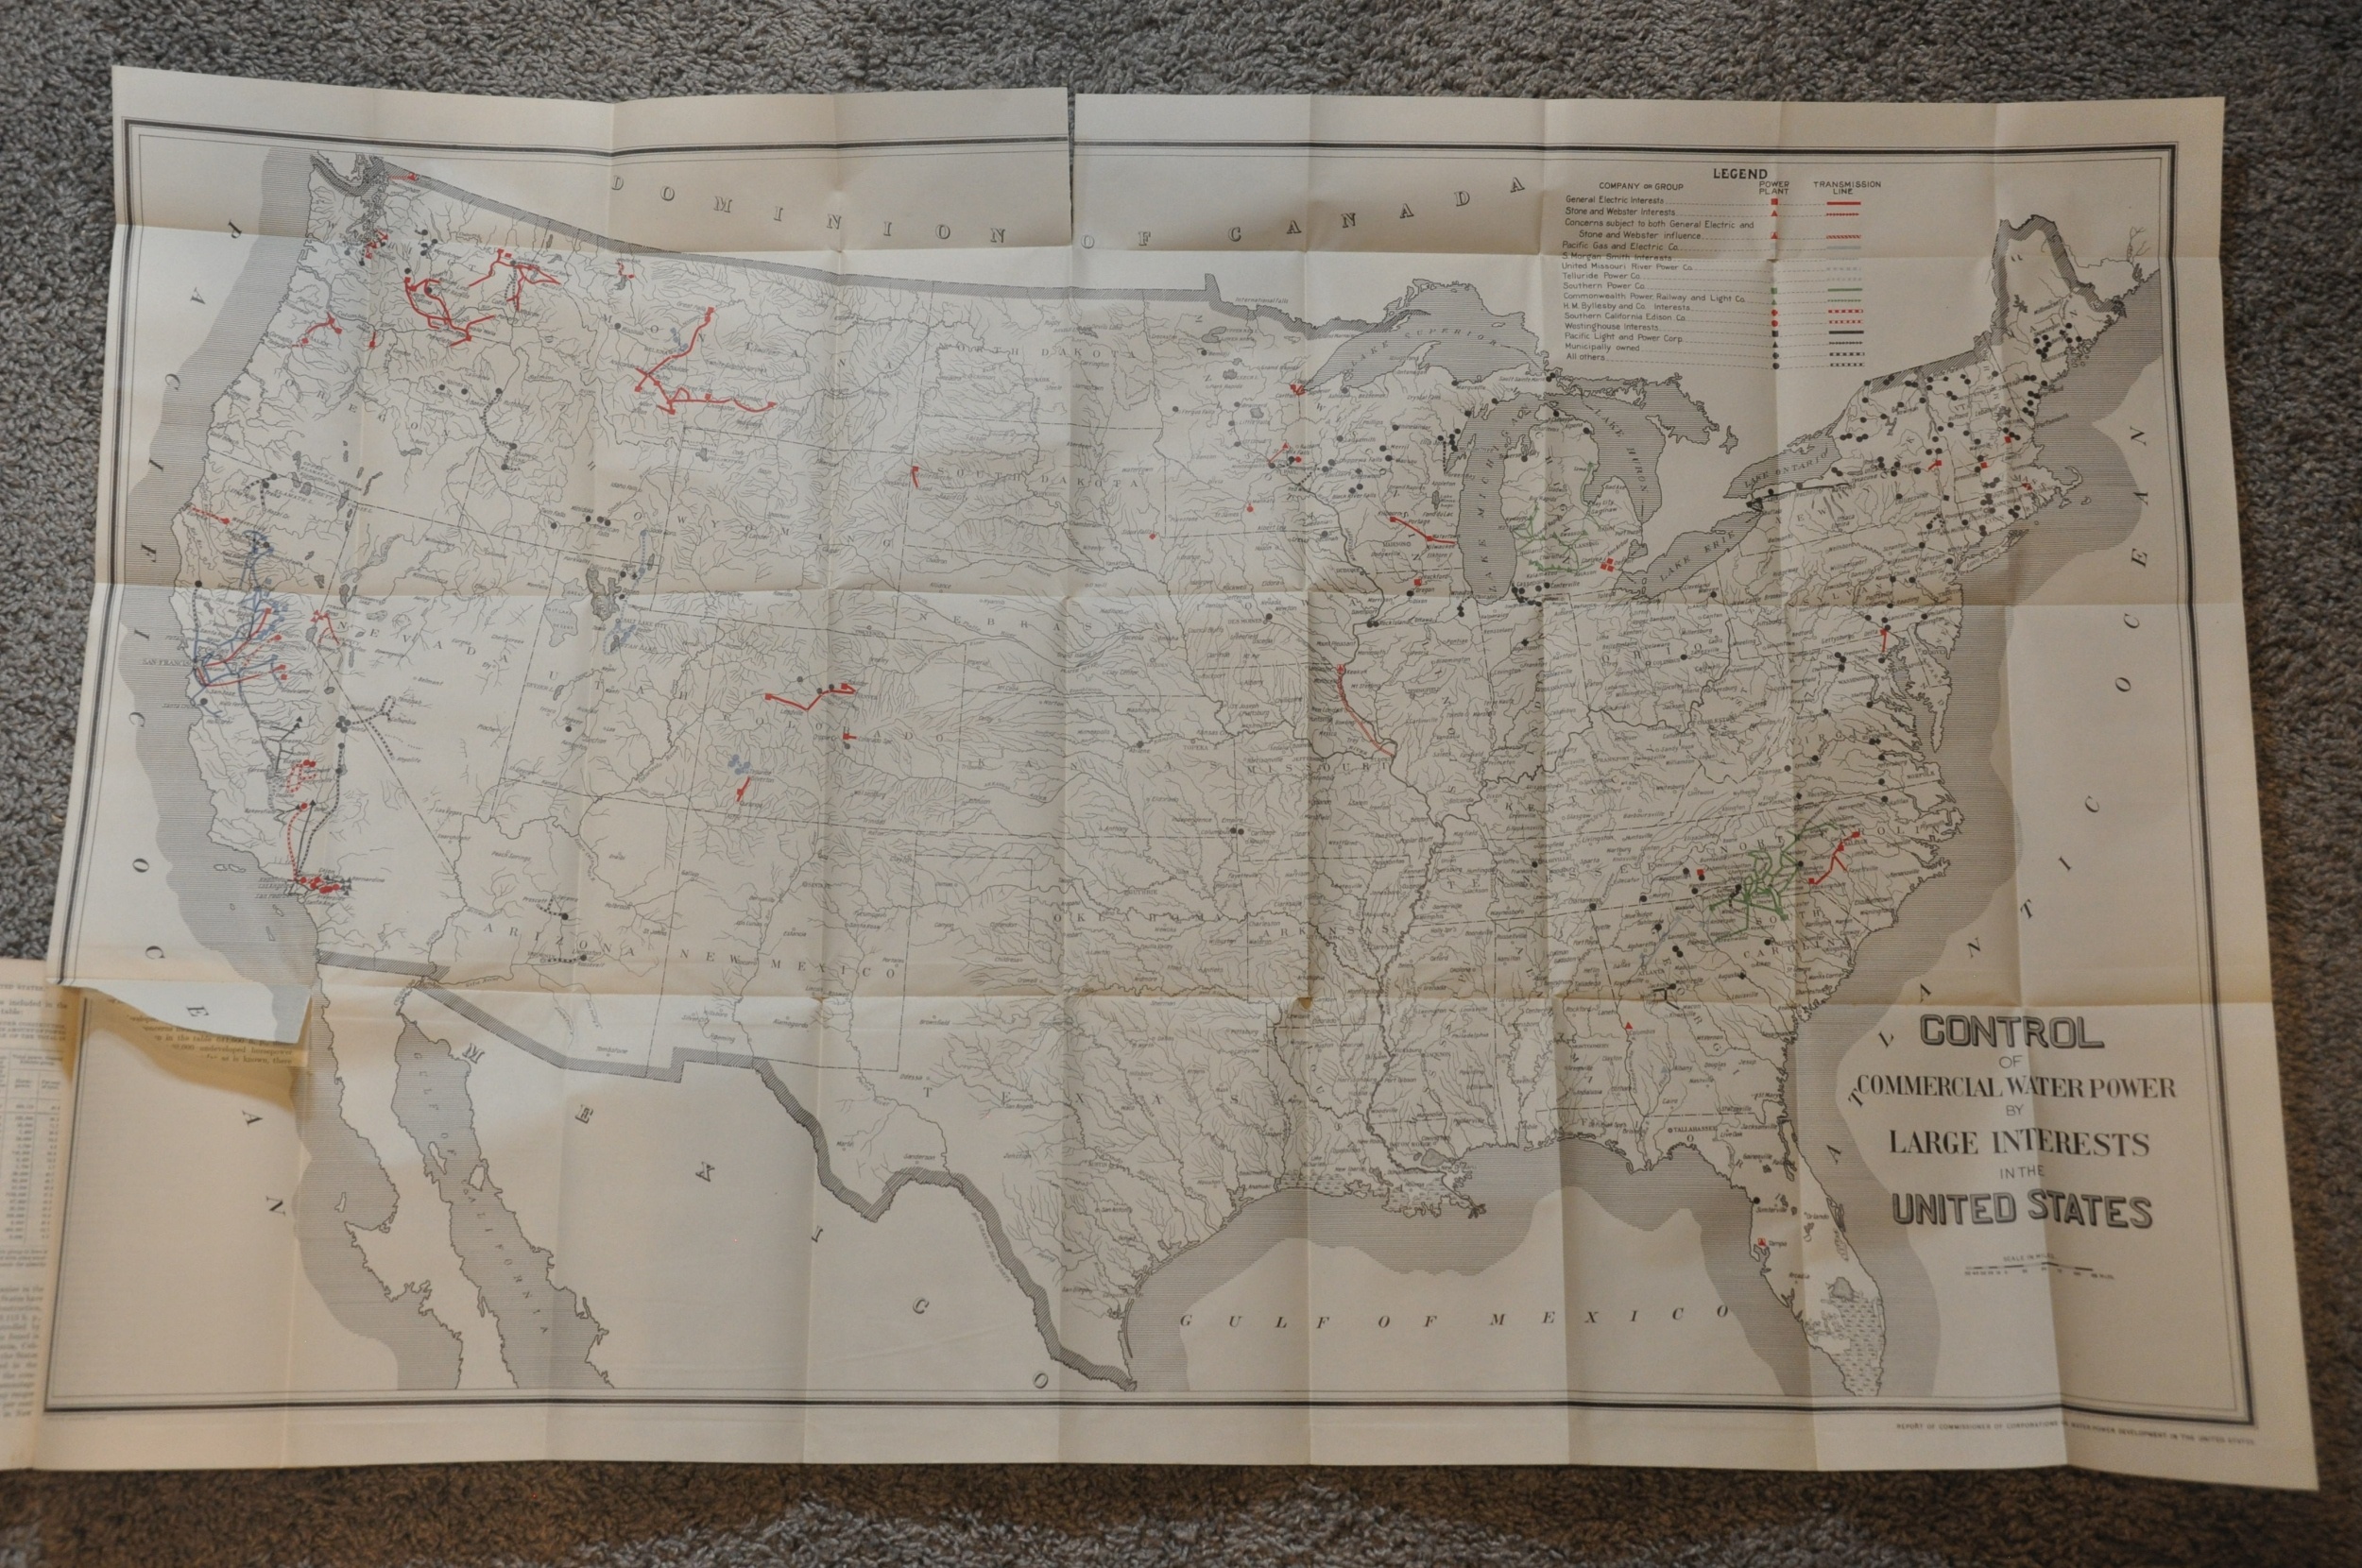
Control of Commercial Water Power by Large Interests in the United States – Measures 42″ x 26.5″ with a 4″ tear in the lower left, where bound. Large map of the United States that highlights the property ownership of the top fourteen producers of commercial water power.
Chart 5 Interrelationships of Important Water Power Interests and Their Relationships To Water Power, Street Railway, and Lighting Companies. Folding diagram that measures 16.5″ x 30″ and shows the conflicting interests between stakeholders in the development of commercial water power.
Sources: Bureau of Reclamation; Department of Energy
Map Details
Publication Date: 1912
Author: U.S. Department of Commerce and Labor
Sheet Width (in): See Description
Sheet Height (in): See Description
Condition: A
Condition Description: 220 pp. + I - XX report bound in original full red embossed leather with gilt spine. Covers and contents are lightly soiled, consistent with age and use, but in very good to near fine condition overall. Includes seven folding maps and charts that show faint wear, light toning, and creasing along fold lines.
$575.00
1 in stock