
Population Distribution, Urban and Rural, in the United States: 1970
$80.00
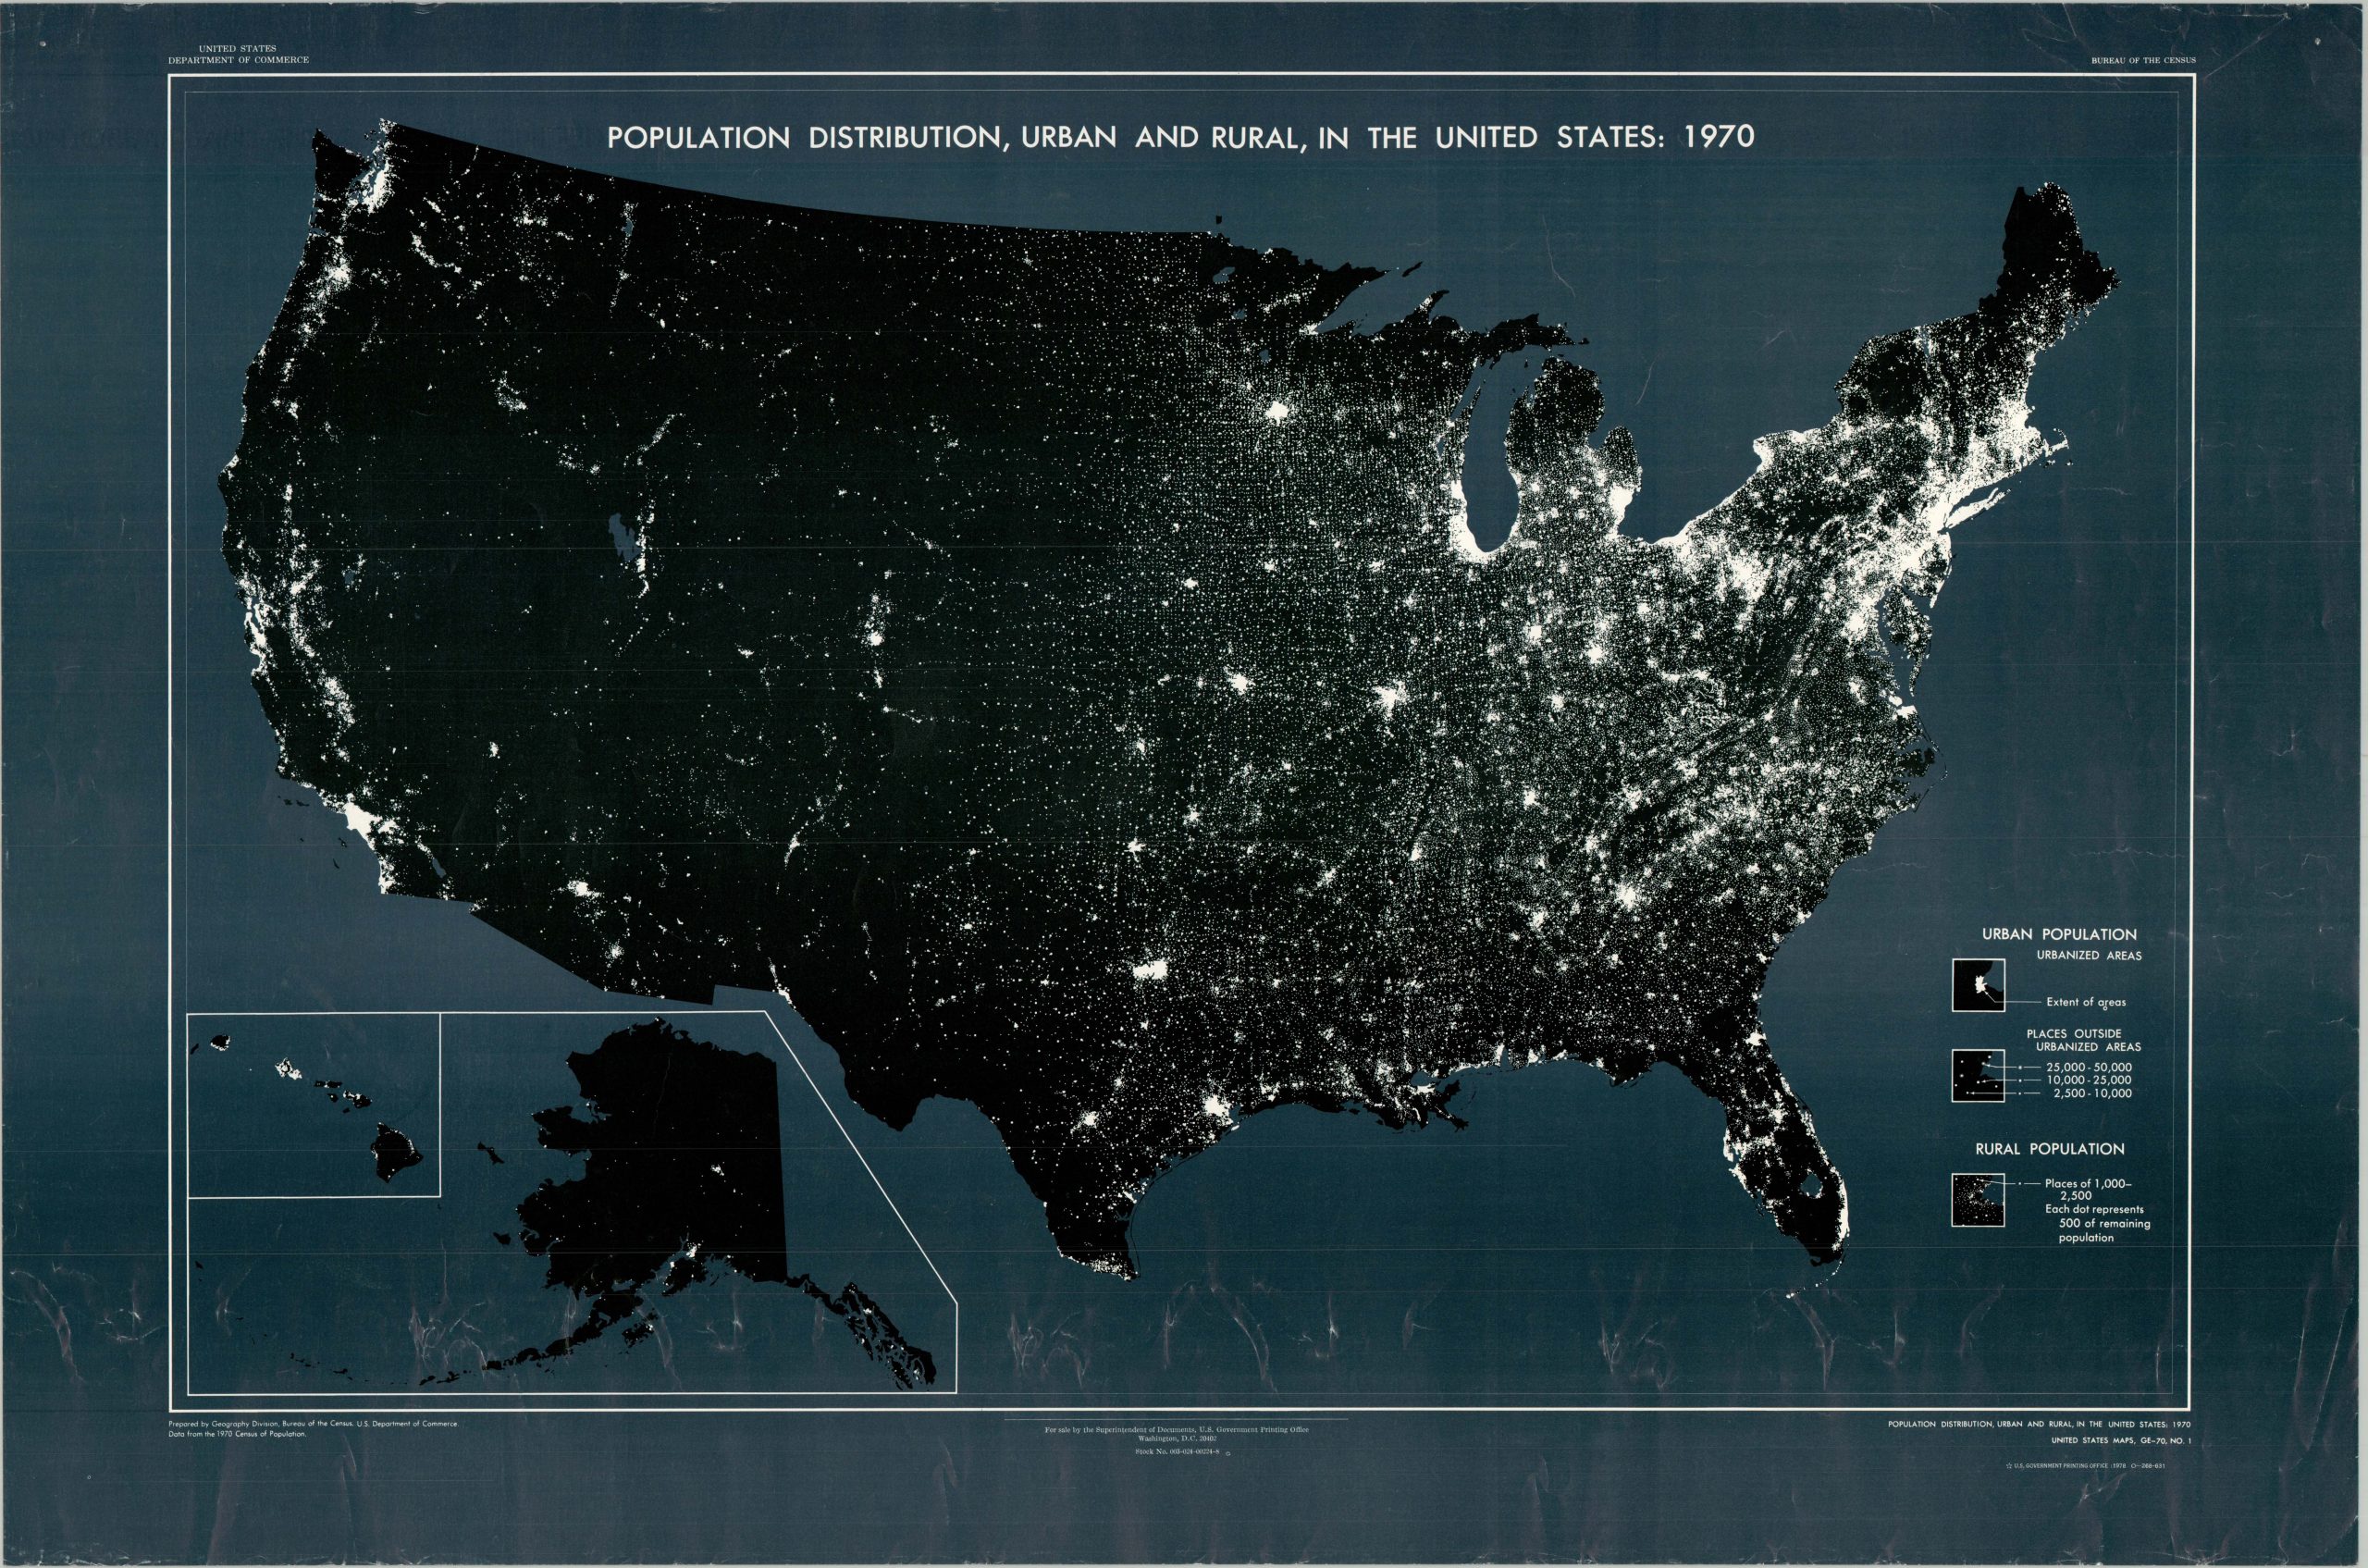
A striking visualization of the U.S. population, according to census data.
1 in stock
Description
While at first glance, this high-contrast population density map may have been imaged from the International Space Station, it’s actually a data visualization method that uses small dots to identify urbanized areas across America. The Northeast Corridor is evidently the most dense, in terms of population, but areas along the West Coast will start to catch up in subsequent decades. Compiled by the U.S. Census Bureau Geographic Division. Published by the Government Printing Office in 1978.
Map Details
Publication Date: 1978
Author: Bureau of the Census Geography Division
Sheet Width (in): 30.25
Sheet Height (in): 20.00
Condition: B
Condition Description: Single-sided map printed on glossy paper. Moderate wrinkling along the lower quarter of the sheet, along with creased corners (and pinholes), and light wrinkling/creasing visible in other areas. About good condition overall.
$80.00
1 in stock