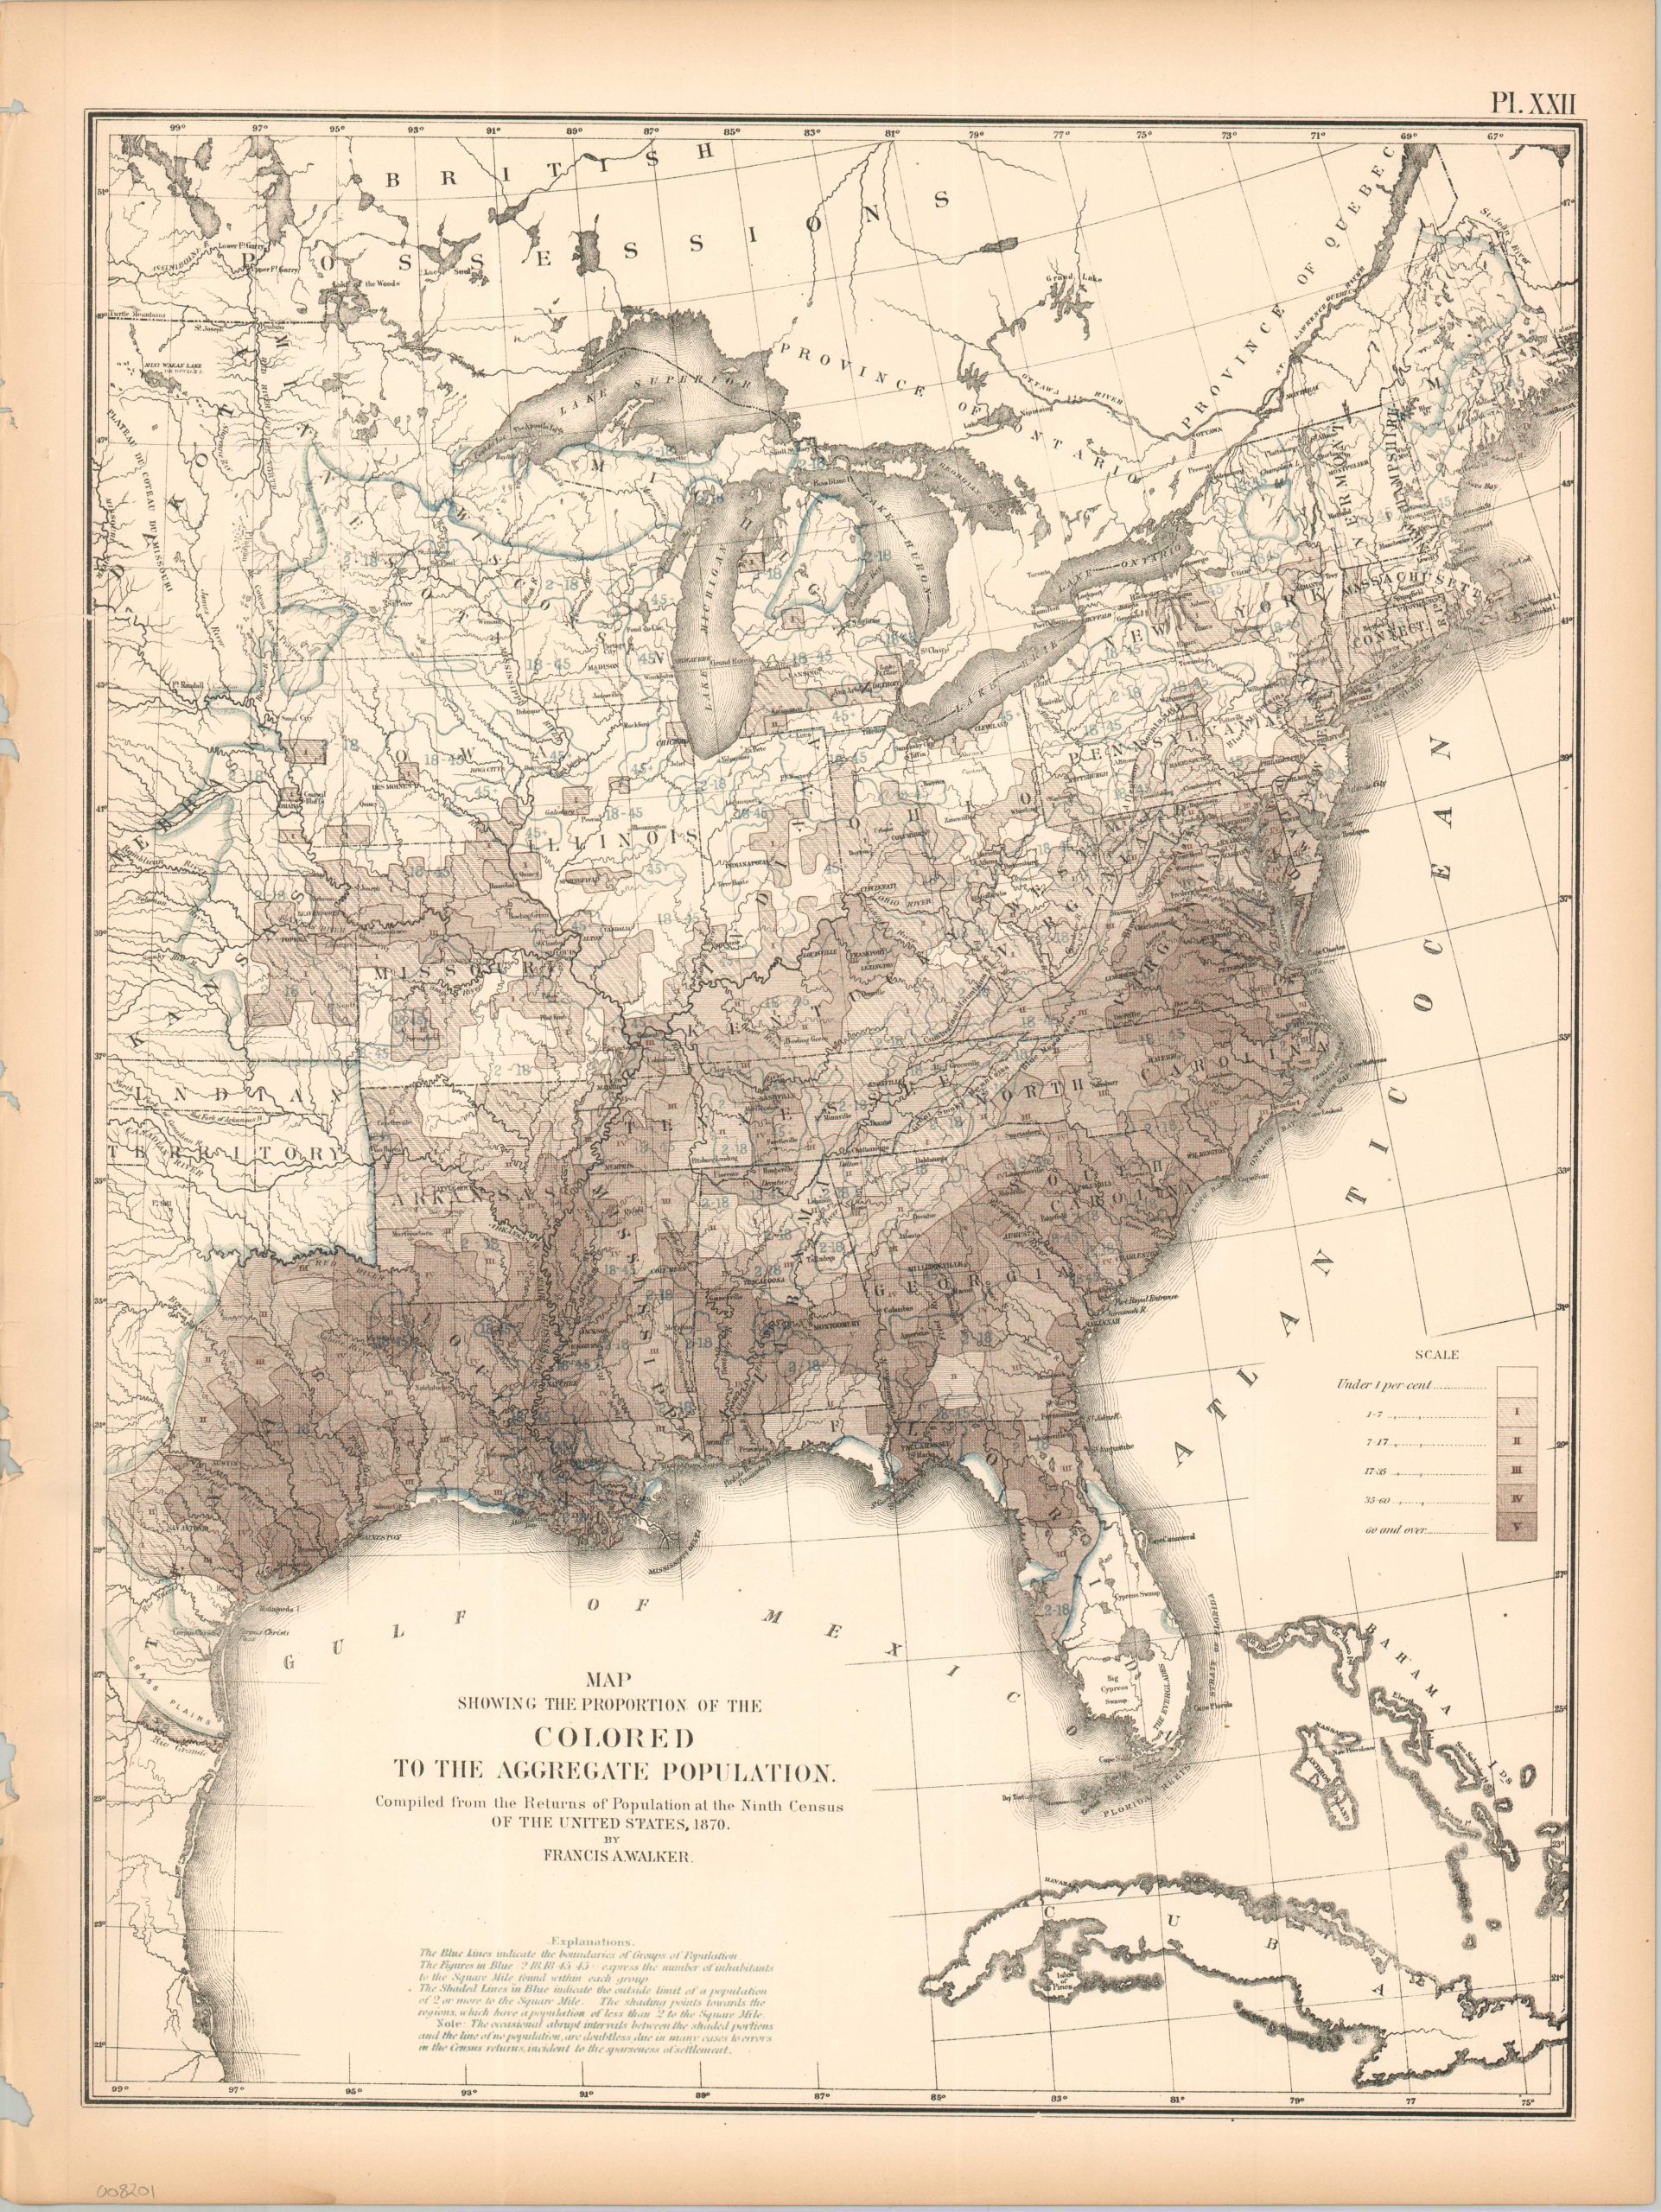
Map Showing the Proportion of the Colored to the Aggregate Population
$75.00
The racial composition of the Eastern United States during the Reconstruction Era.
1 in stock
Description
This interesting map of the United States east of the 100th meridian uses five shades of coloration to highlight the percentage of African-American residents. Areas without shading are under 1 percent of the population, whereas the darkest areas show the ‘Colored’ populations of 60% or higher. The crescent-shaped ‘Black Belt’ (referring to the soil, not the inhabitants) from Virginia through the Deep South and the alluvial floodplains of the Mississippi River has the highest concentrations of (formerly enslaved) African-Americans due to the labor-intensive cash crops sold there. Essentially, the map is an encapsulation of the plantation economy that supported the South during Reconstruction. Faint blue printing reflects the population density per square mile.
The sheet was originally issued as part of The Statistical Atlas of the United States Based on the Results of the Ninth Census, 1870, compiled by Census Superintendent Francis A. Walker. Lithographed by Julius Bien and published in 1874. The atlas serves as the ultimate 19th-century “data portrait” of a reunified nation, meticulously synthesizing geography, climate, and demographics into a visual manifesto of America’s industrial and economic potential.
Map Details
Publication Date: 1874
Author: Francis A. Walker
Sheet Width (in): 16.25
Sheet Height (in): 21.75
Condition: B+
Condition Description: Lithographed sheet on somewhat brittle paper. Moderate marginal wear including a ragged left edge, toning, faint damp staining in the lower left, and a few small closed tears
$75.00
1 in stock