Map Showing the Distribution of Wealth
$60.00
Where’s the money, Lebowski?
1 in stock
Description
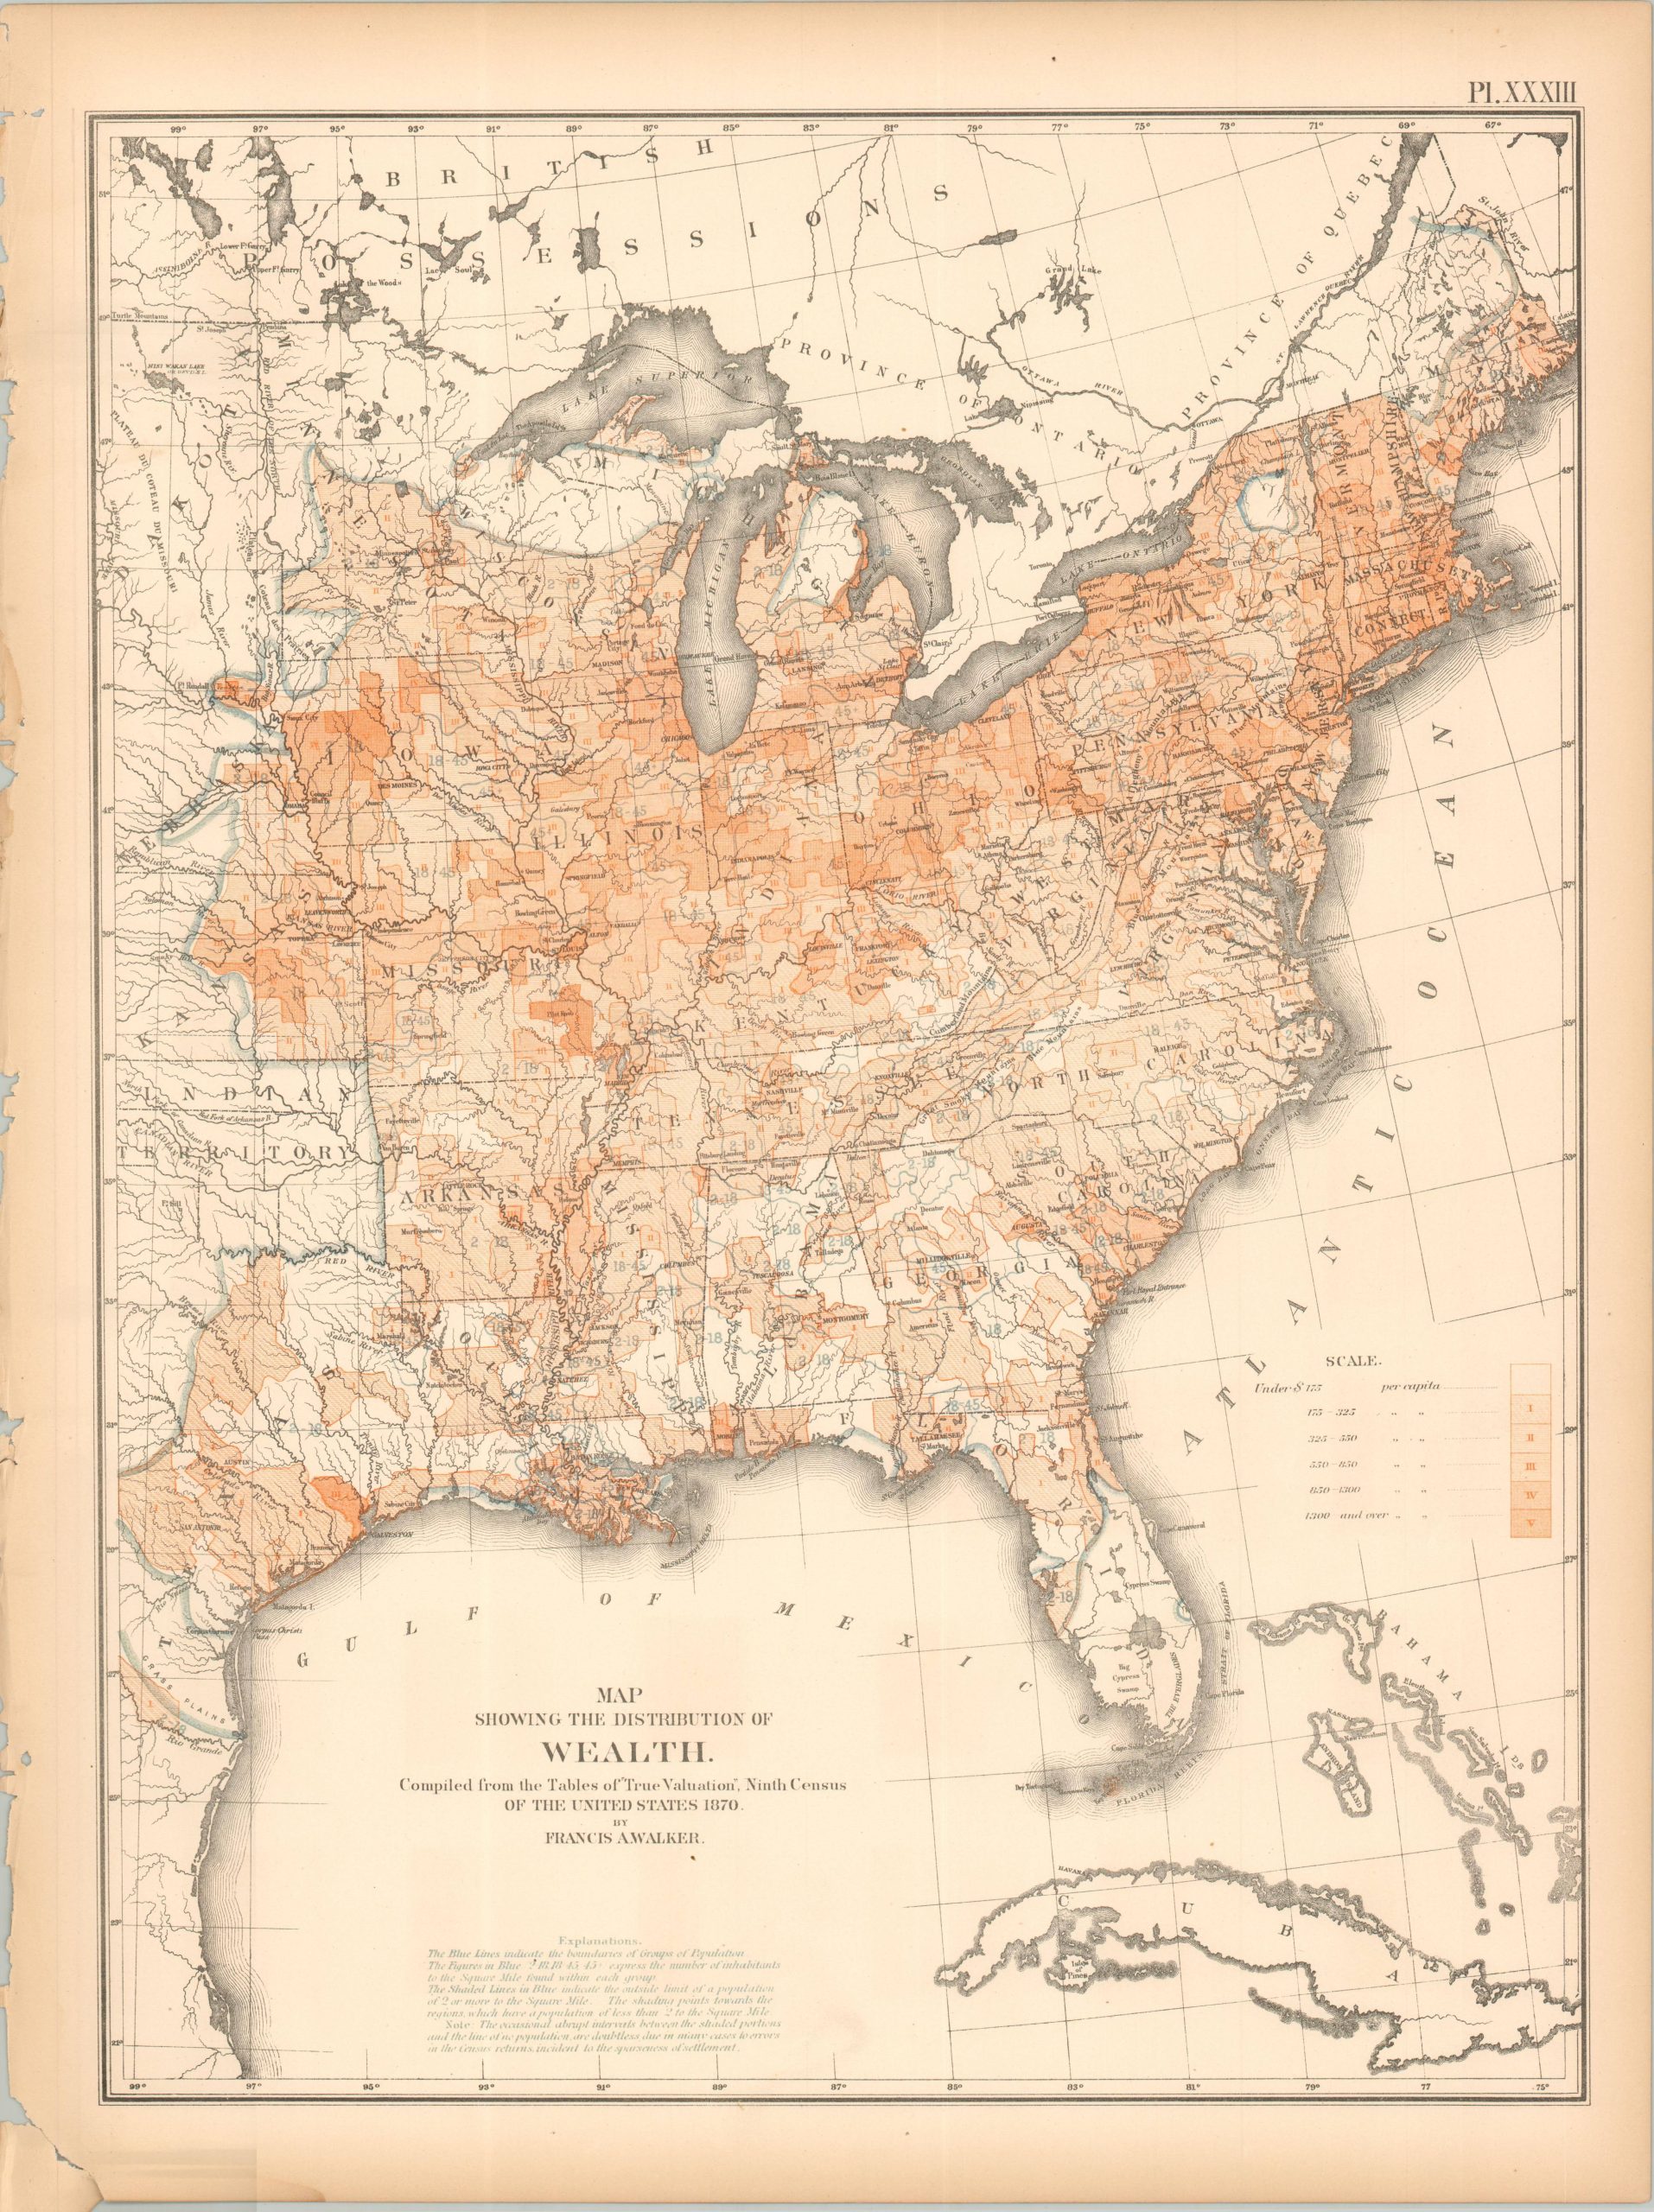
This interesting map of the Eastern United States uses five shades of orange to highlight the wealth of the population. The scale ranges from under $175 per capita (white) to $1300 per capita and up (the darkest) – a huge distinction! The Ohio River Valley and the Northeast Corridor both show large concentrations of wealth. More localized examples include the iron industry around Pilot Knob, exports at Galveston, and the fertile fields of central Iowa. Large swathes of the Southern United States remain deeply impoverished. Faint blue printing reflects the population density per square mile.
The sheet was originally issued as part of The Statistical Atlas of the United States Based on the Results of the Ninth Census, 1870, compiled by Census Superintendent Francis A. Walker. Lithographed by Julius Bien and published in 1874. The atlas serves as the ultimate 19th-century “data portrait” of a reunified nation, meticulously synthesizing geography, climate, and demographics into a visual manifesto of America’s industrial and economic potential.
Map Details
Publication Date: 1874
Author: Francis A. Walker
Sheet Width (in): 16.25
Sheet Height (in): 21.75
Condition: B+
Condition Description: Lithographed sheet on somewhat brittle paper. Moderate marginal wear including a ragged upper edge, toning, and a few small closed tears
$60.00
1 in stock