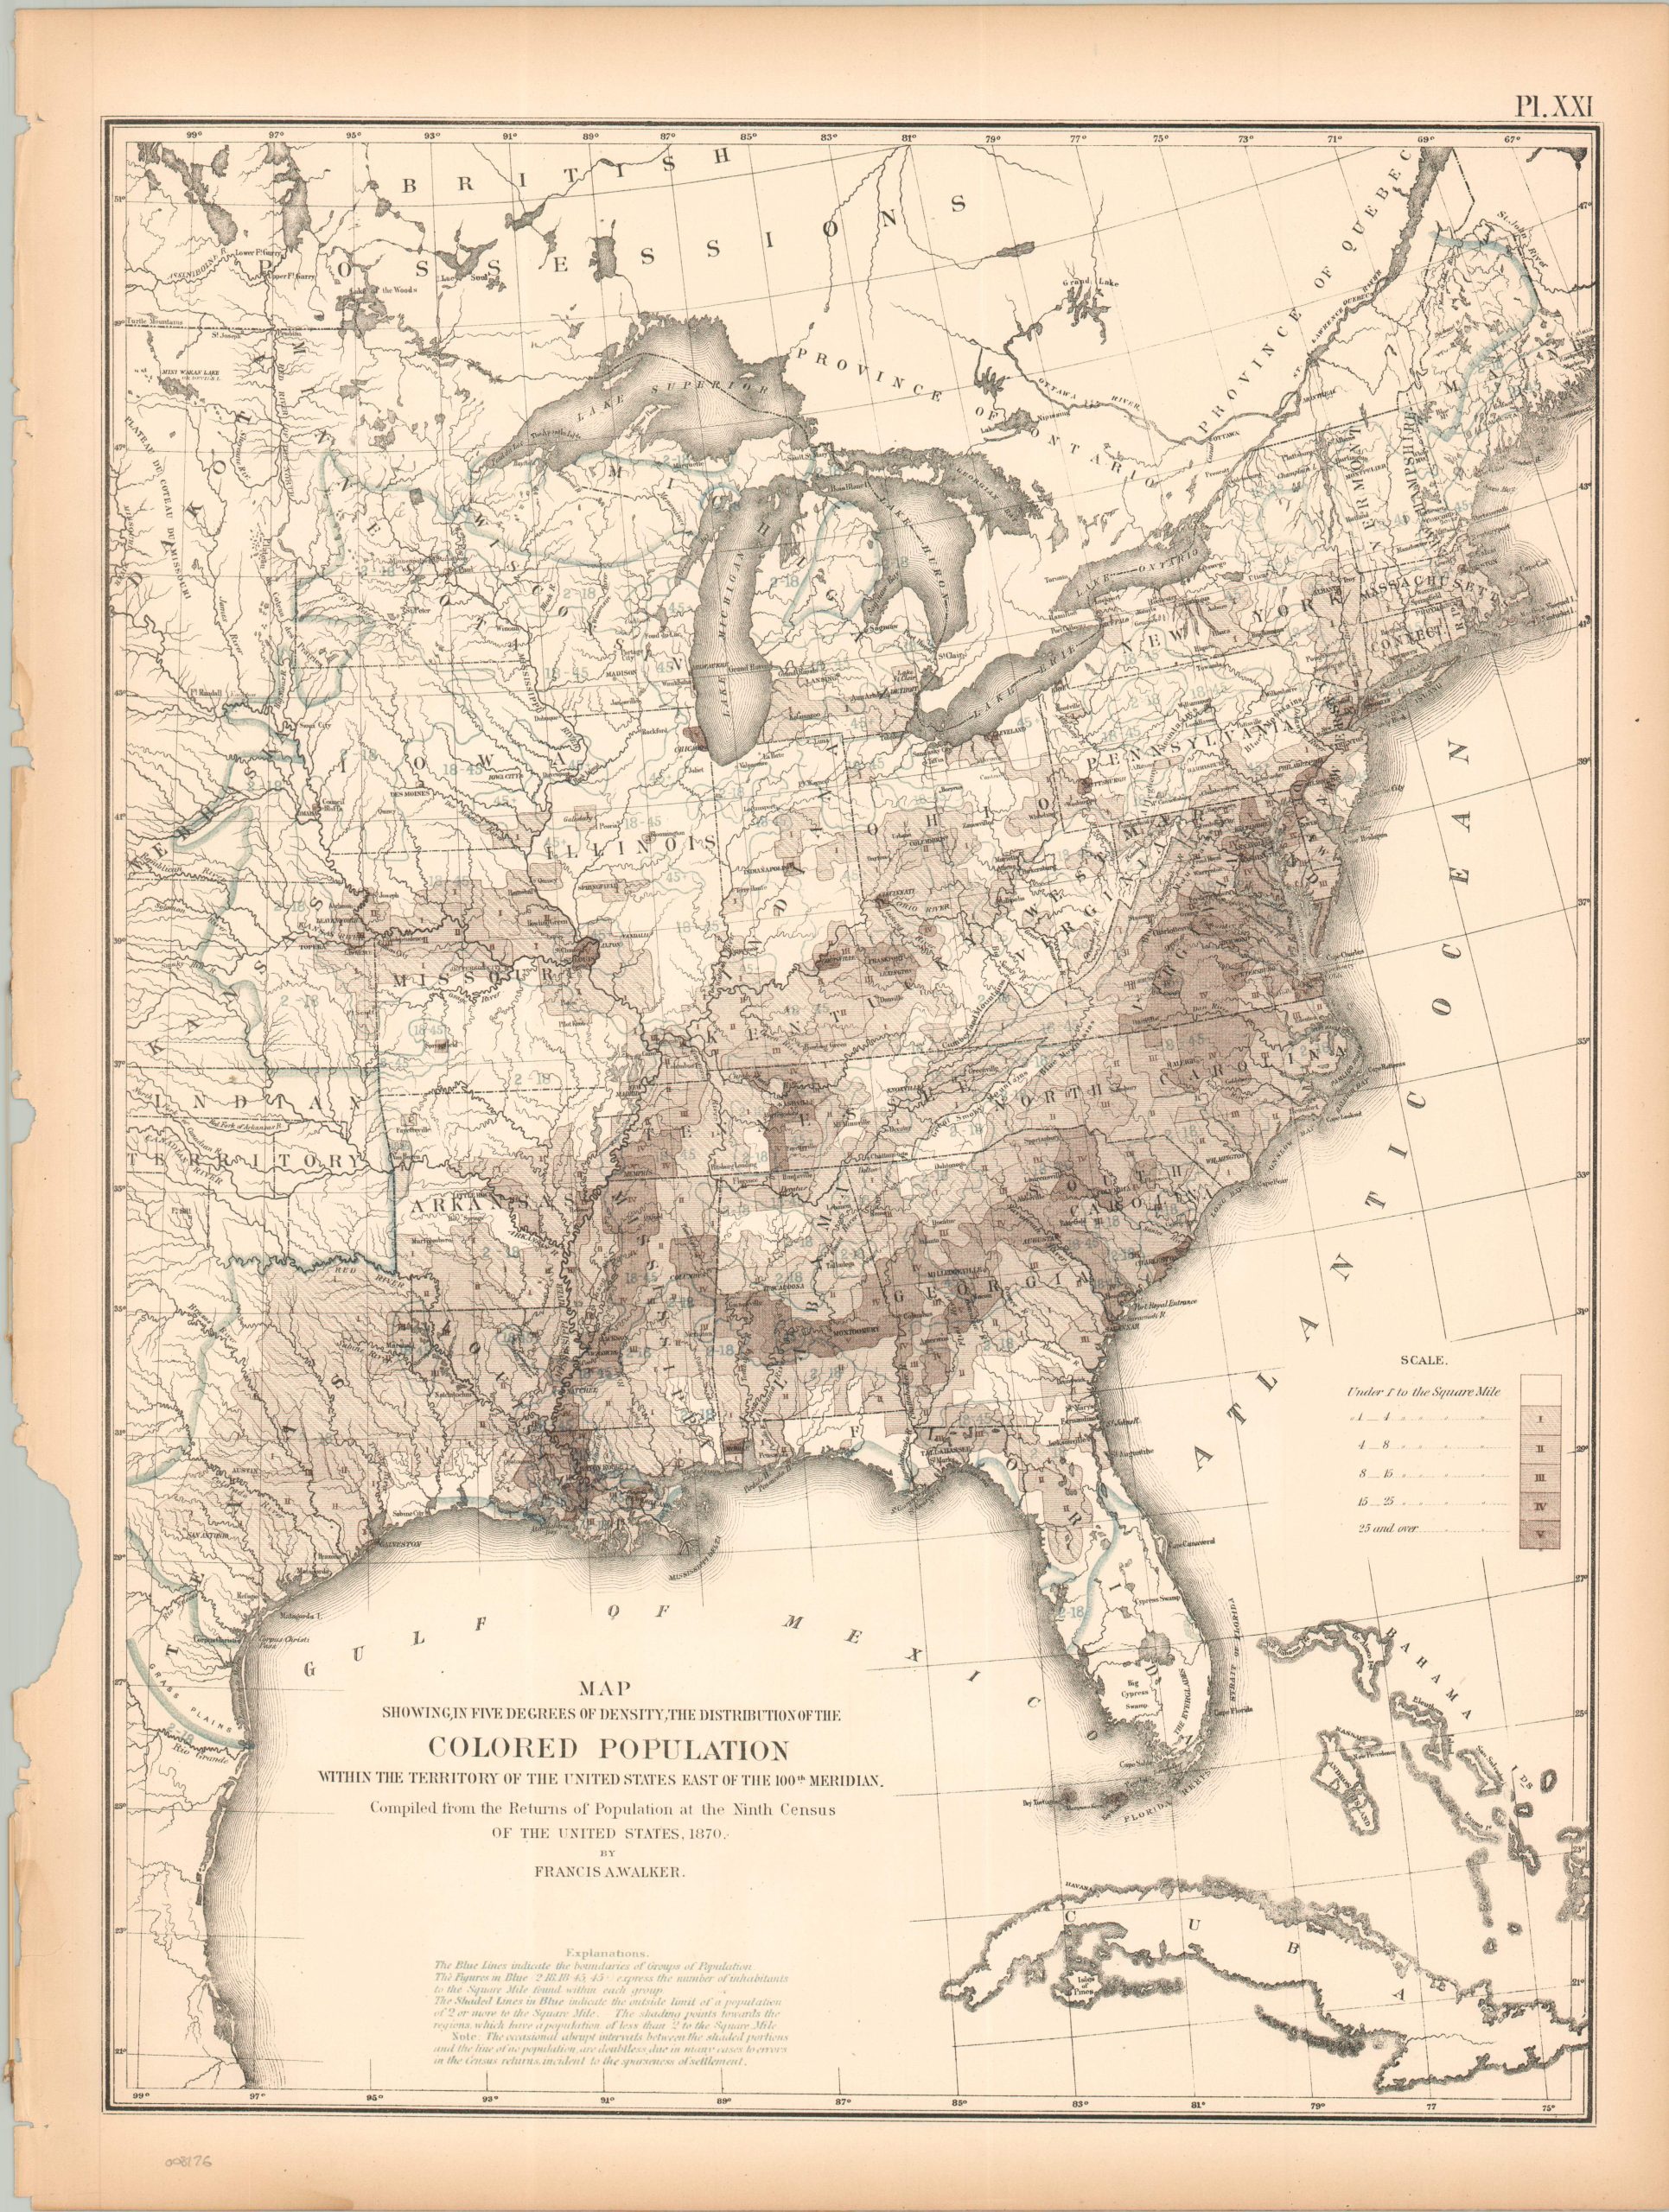
Map Showing, in Five Degrees of Density, the Distribution of the Colored Population within the Territory of the United States East of the 100th Meridian
$60.00
The distribution of African-Americans across the eastern U.S. during the Reconstruction Era.
1 in stock
Description
This intriguing analytical map of the eastern United States uses five shades of coloration (and the absence thereof) to highlight the density of the African-American population, ranging from under 1 individual per square mile (white) to 25+ (the darkest shade). Heavy concentrations can be seen in the agriculturally dominant regions of the south, plus urban areas like St. Louis, Chicago, Pittsburgh, and Cincinnati.
The map was originally issued as part of The Statistical Atlas of the United States Based on the Results of the Ninth Census, 1870, compiled by Census Superintendent Francis A. Walker. Lithographed by Julius Bien and published in 1874. The atlas serves as the ultimate 19th-century “data portrait” of a reunified nation, meticulously synthesizing geography, climate, and demographics into a visual manifesto of America’s industrial and economic potential.
Map Details
Publication Date: 1874
Author: Francis A. Walker
Sheet Width (in): 16.25
Sheet Height (in): 21.75
Condition: B
Condition Description: Lithographed sheet with moderate marginal wear, including toning, a ragged left edge (with a large chip), and a few small tears.
$60.00
1 in stock