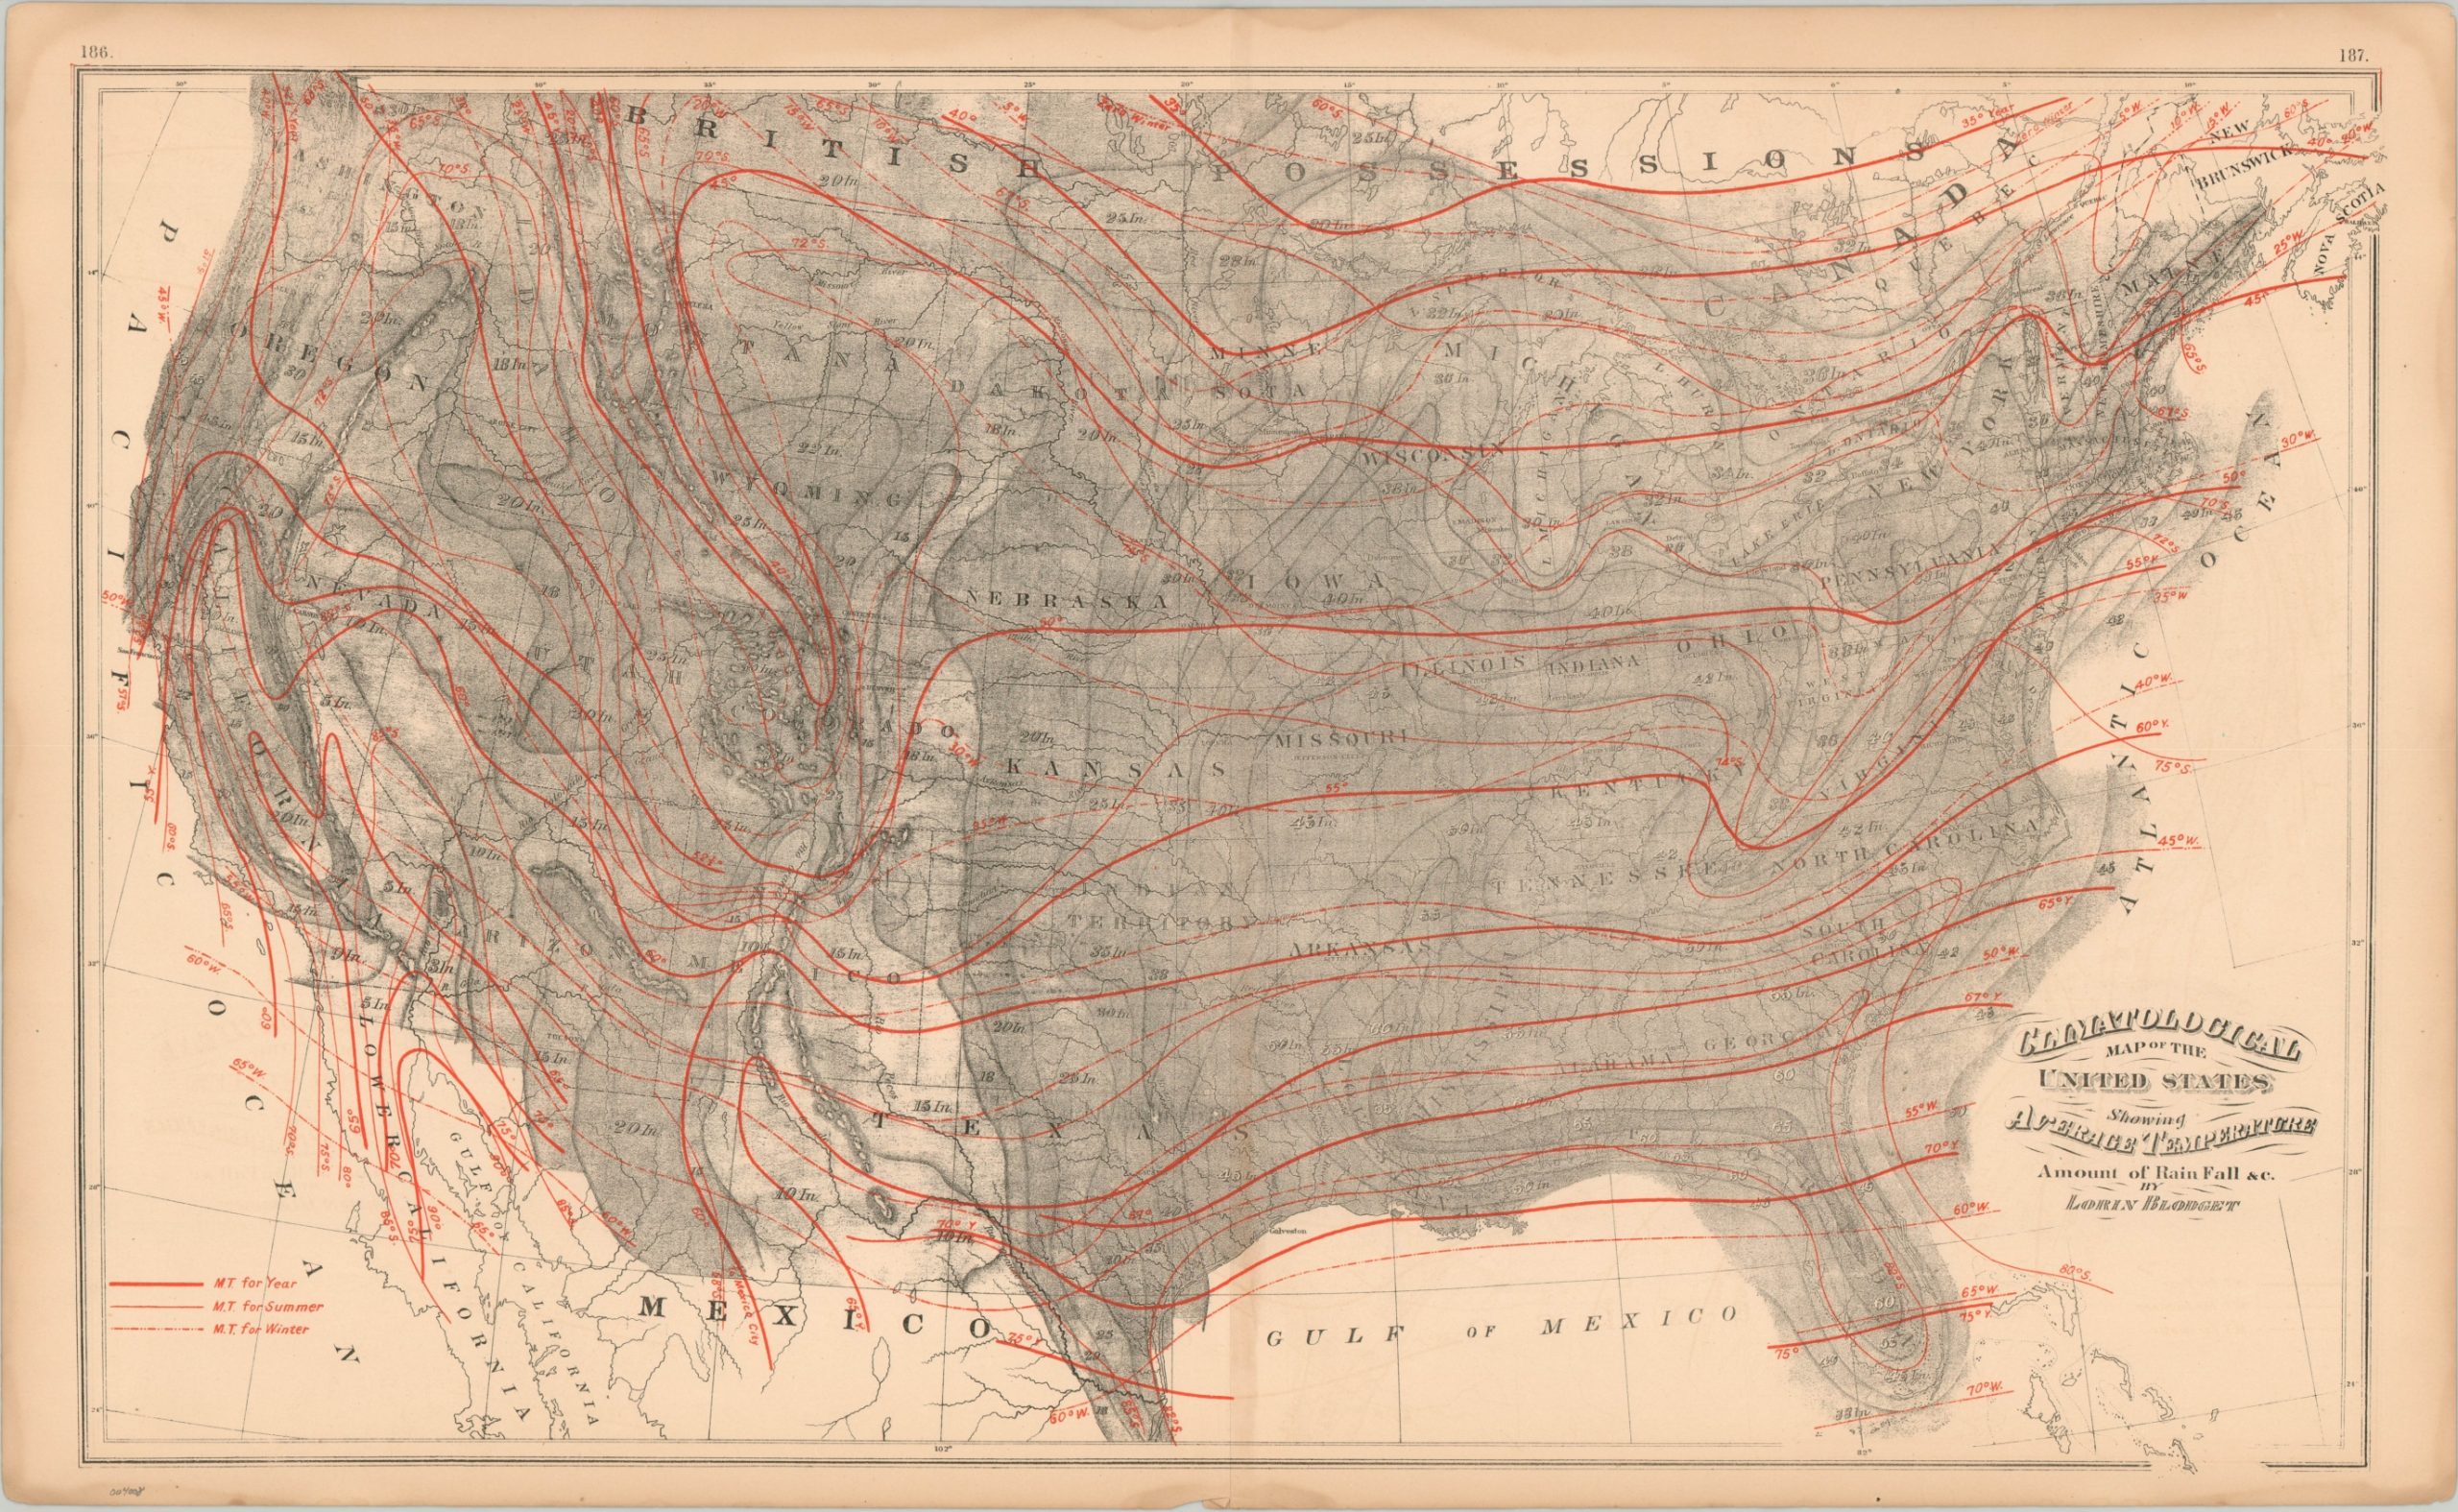
Climatological Map of the United States Showing Average Temperate Amount of Rainfall &c.
The average temperature and rainfall across the U.S. during the mid-1870s.
Out of stock
Description
This steel engraved map uses an interesting mix of lines and shading to present climatology data across the continental United States. Three different red lines show the annual, summer, and winter mean temperature with wide labeled bands. Similarly, darker areas represent regions with greater rainfall; with the Gulf of Mexico of the Pacific Northwest receiving the most at 65+ inches annually.
Though not exactly precise, the information was novel for the time. The map was created by Lorin Blodget, a former professor at the Smithsonian and one of the first climate scientists in America. Though he was fired from the Smithsonian as a result of a political dispute, Blodget would have a successful career as a commercial cartographer and work for the War Department. This example was published in Philadelphia by O.W. Gray in 1876.
Map Details
Publication Date: 1876
Author: Lorin Blodget
Sheet Width (in): 27.75
Sheet Height (in): 17
Condition: A-
Condition Description: Faint damp staining confined to the outer margins of the sheet. Some light discoloration along the vertical centerfold, but overall in very good condition.
Out of stock

