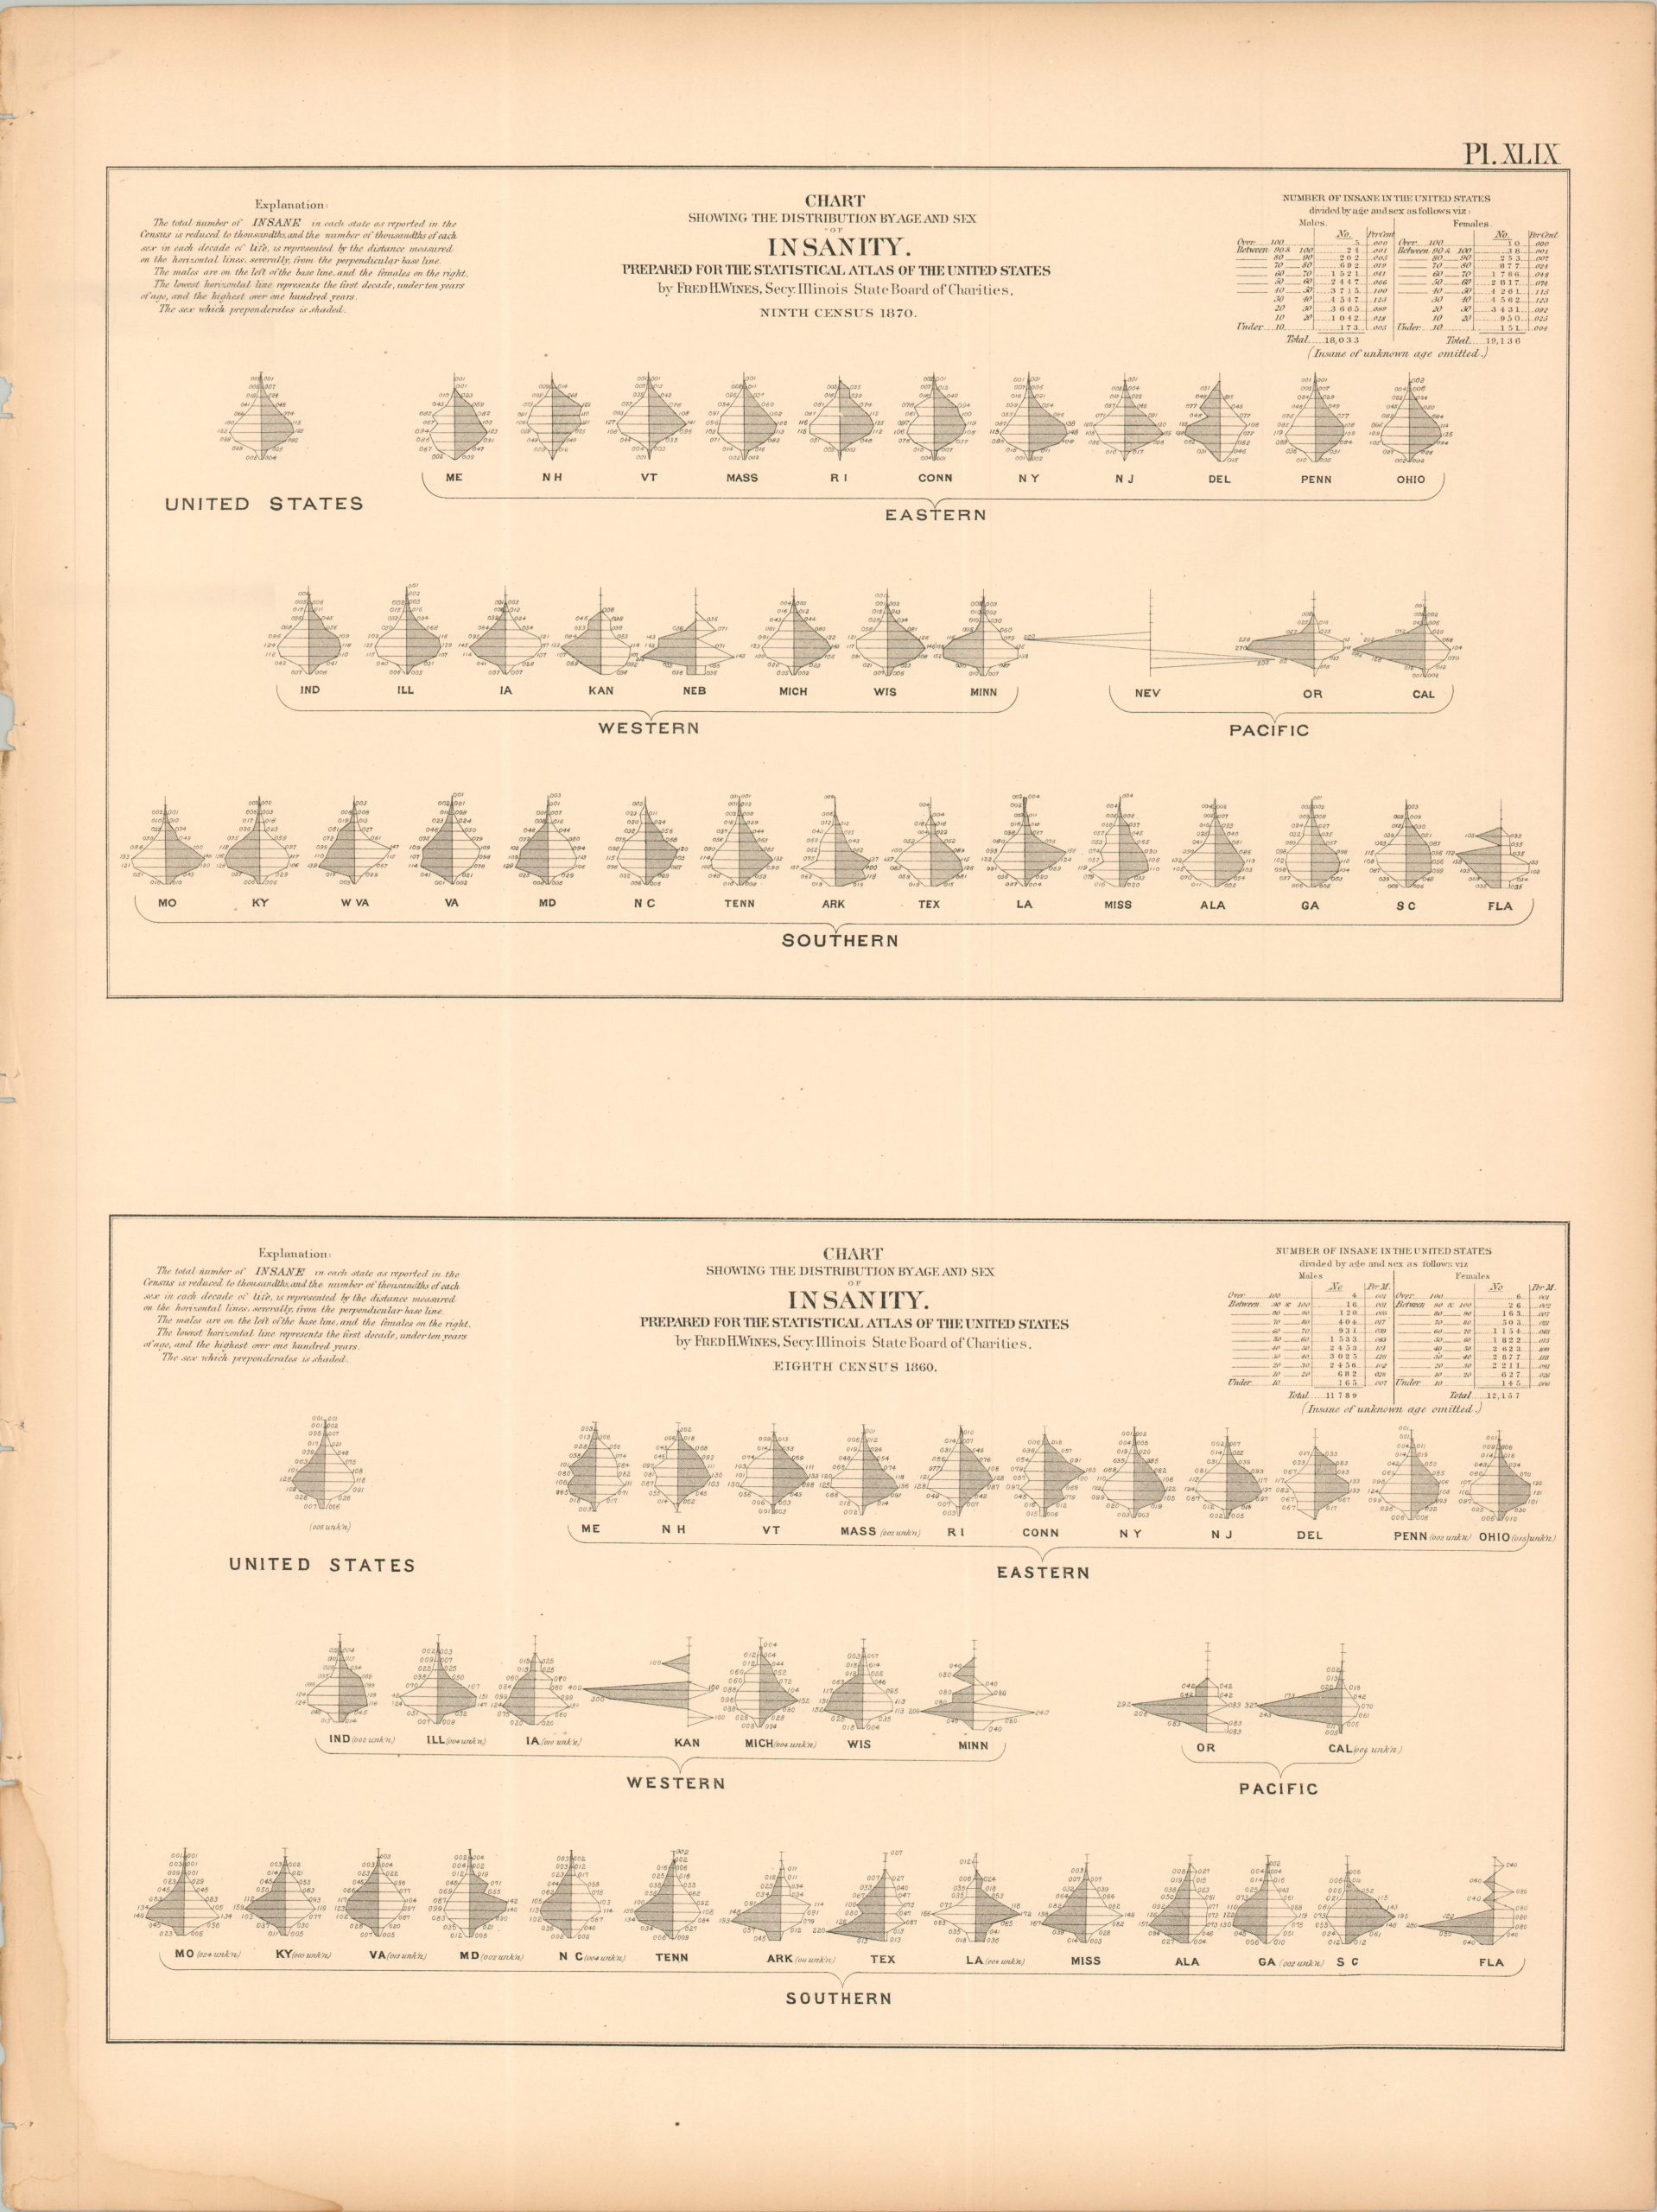
Chart Showing the Distribution by Age and Sex of Insanity
$60.00
The distribution of the ‘insane’ across the U.S. during the Reconstruction Era.
1 in stock
Description
This unusual assortment of line charts was assembled by Frederick H. Wines, the Secretary of the Illinois Board of Charities. The upper grouping shows the distribution of clinically diagnosed insanity, by age and sex, of each state and territory according to the results of the 1870 census. The lower selection offers the same information, based on the prior census of 1860 (there was a significant increase).
The chart was originally issued as part of The Statistical Atlas of the United States Based on the Results of the Ninth Census, 1870, compiled by Census Superintendent Francis A. Walker. Lithographed by Julius Bien and published in 1874. The atlas serves as the ultimate 19th-century “data portrait” of a reunified nation, meticulously synthesizing geography, climate, and demographics into a visual manifesto of America’s industrial and economic potential.
Map Details
Publication Date: 1874
Author: Frederick Wines
Sheet Width (in): 16.25
Sheet Height (in): 21.75
Condition: B
Condition Description: Lithographed sheet with moderate marginal wear, including toning, a ragged left edge, some damp staining, and a few small tears.
$60.00
1 in stock